You’re probably tired of reading about low volatility. The CBOE Volatility Index, or VIX, has been near record lows for months.
VIX is also known as the Fear Index. It rises when prices fall. Low VIX readings mean there’s a low level of fear. In other words, analysts are afraid there’s not enough fear.
Fear is low, according to the Fear Index. But the VIX only goes back to 1990. Looking at history before 1990, the current level of volatility is nothing to worry about.
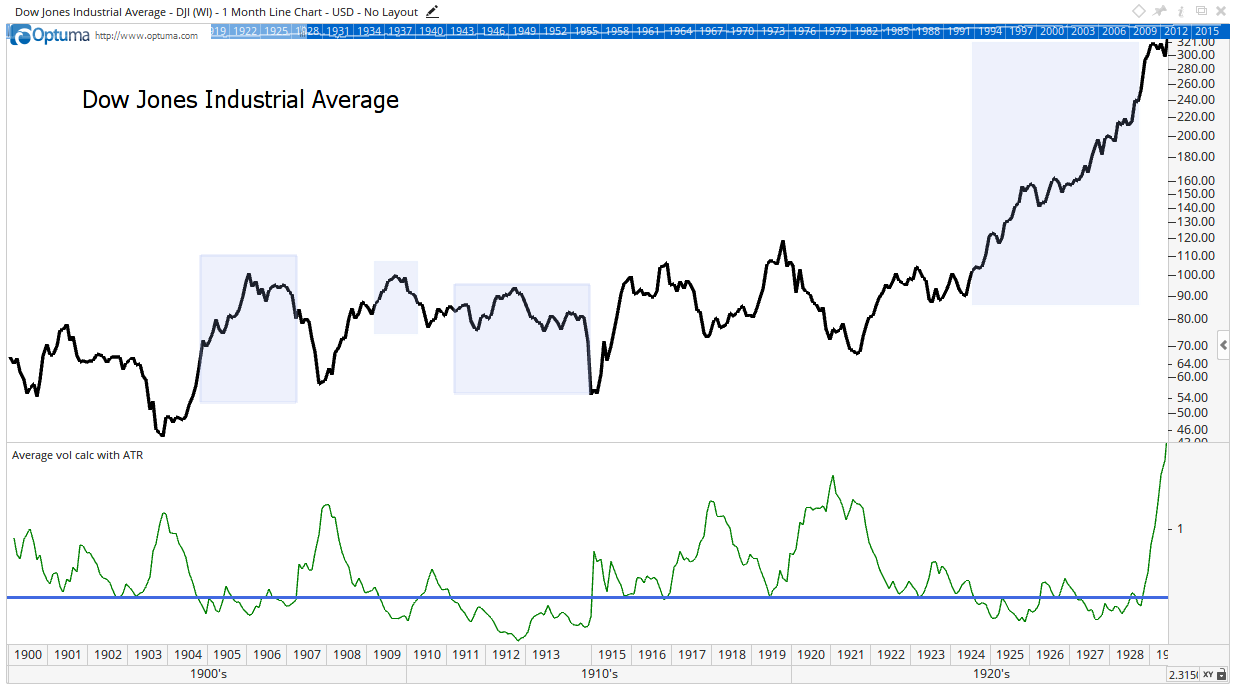
The Dow Jones Industrial Average in the early 1900s is at the top in the chart below. Volatility is at the bottom of the chart. The current level of volatility is the horizontal blue line at the bottom. Light blue rectangles mark the price action when volatility was low.

For this chart, the average true range (ATR) indicator measures volatility. This indicator measures how much prices move each day. The green line is the average ATR for the previous 12 months. This indicator lets us measure volatility all the way back to the 1800s.
Volatility was low during the bull market from 1904 to 1907. Volatility was low in 1909, and again from 1911 to 1915. These were all bull markets. Dividends accounted for most of the returns in that era.
From 1924 to 1929, the Dow gained an average of 24.9% a year. That bull market started after prices gained 16%.
That time looks a lot like 2017. In 1924, the Federal Reserve lowered interest rates to record lows. Inflation was falling. The economy was growing.
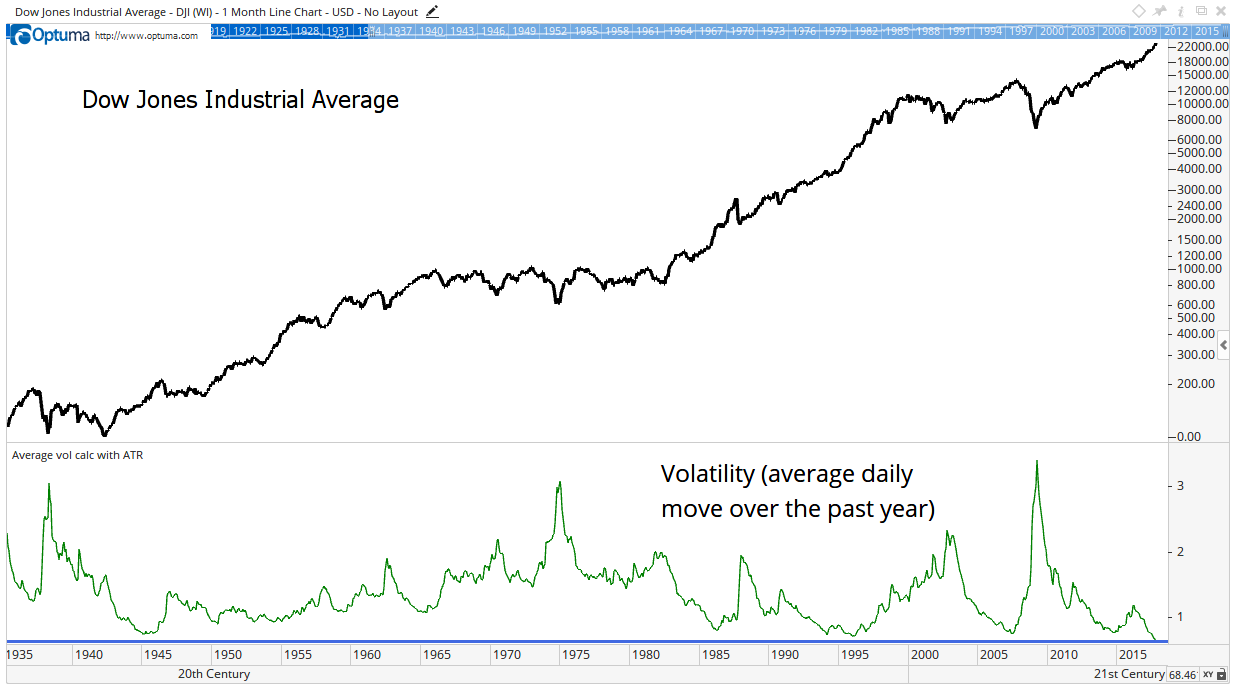
The current reading of the indicator is in the next chart.

Volatility is at an 80-year low. With low inflation, low-interest rates and steady economic growth, this stock market could double in the next four years.
That puts the Dow at 57,000. And history tells us that a unimaginably strong bull market is possible.


Leave A Comment