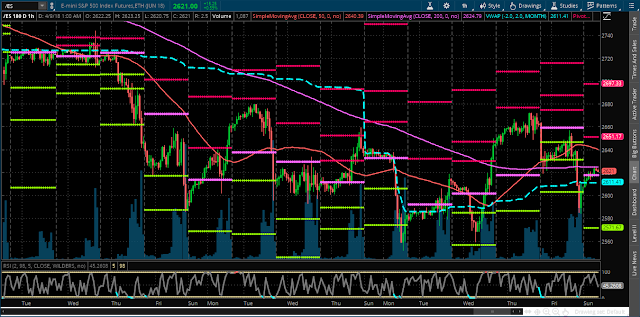
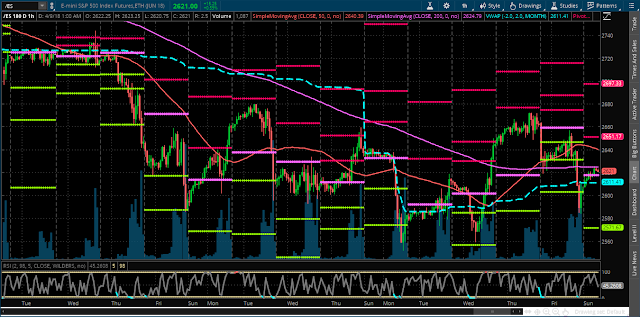
My brief observations on the 60 minute (extended hours) chart of the S&P 500 E-mini Futures Index(ES) are as follows.
We have a big range in between Monday’s S1 & R1, but, if price holds above PP, we may see a retest of R1 at some point…otherwise, if it beaks and holds below S1, we could see price retest Feb’s low of 2529 (Monday’s S2 is 2538), or drop lower.


Leave A Comment