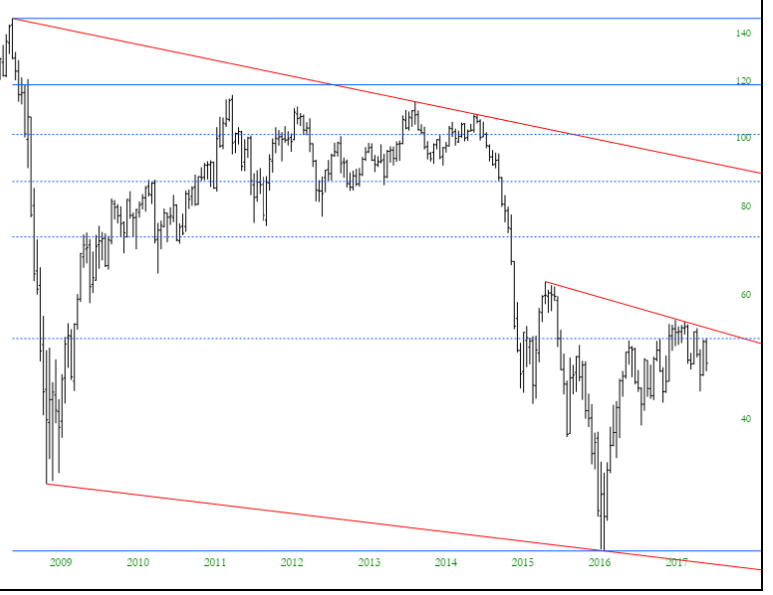
On the whole, the market remains incredibly and annoyingly stuck. One sector which has mercifully been on the move, and which has been my focus most of the year, is energy. The cool thing about crude oil is that, in spite of its big down-move today, the long-term chart on oil suggests there could be plenty more downside.

Indeed, I find it kind of fascinating that crude oil is as weak as it is in spite of utter mayhem in the Middle East and, of course, the stifling interference of the OPEC cartel. Subject to natural market forces, oil would certainly be lingering into the 20s instead of the 40s. In any event, it remains my favorite and most tradeable sector.
One other area that I’m hoping will break free at some point is the financials. You want to see a “stuck” graph? Just look at XLF, shown below. This provides a broad overview as to where the financial stocks are, and prices are exactly where they were in December 2016! (By way of contrast, Amazon is up over 40% in the same timespan). Prices for financial equities are completely hemmed in, but I’m banking on the eventual break of that lower horizontal.

The easy trade for the past few months (which, regrettably, I didn’t take, since I’ve been hopping in and out instead) is simply staying long such leveraged instruments as ERY and DRIP, the latter of which is shown below. I already knew about ERY, but redvettes turned me on to DRIP, and it’s up about 30% from when I first started yammering about it. It’s easy to picture higher prices ahead this summer.

What gives me the most hope as one of Earth’s very last remaining bears is the utterly-destroyed world of volatility. This is mid-2006 all over again. Just look at the chart. The entire market has deeply inhaled the now-legal cannabis from coast to coast, and it is convinced that not only are happy days here again, but they will never, ever leave. I disrespectfully disagree.


Leave A Comment