
Using the most representative or notable index/ETF for each segment, let’s update the general status for a range of items (U.S. and global stocks, T bonds, commodities and gold) with a few informal thoughts.
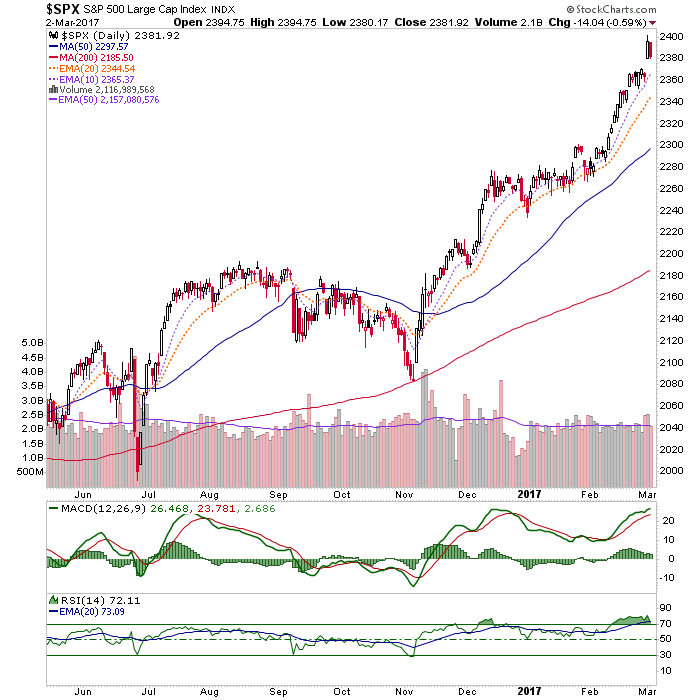
As it’s older brother, the Dow, exceeds our target (21,000), the S&P 500 lurks just below its target of 2410. While the market can (and probably should) correct at any time, the lack of climactic volume (ref. yesterday’s post comparing the current Dow to Silver in 2011) along with over bullish sentiment that continues to resist becoming massively (as in ‘all in’) over bullish imply that such a correction would be a pit stop, not a bear market.
Alternatively, a continued push higher that gains momentum and volume would likely be a gateway to a bear market when it tops out.
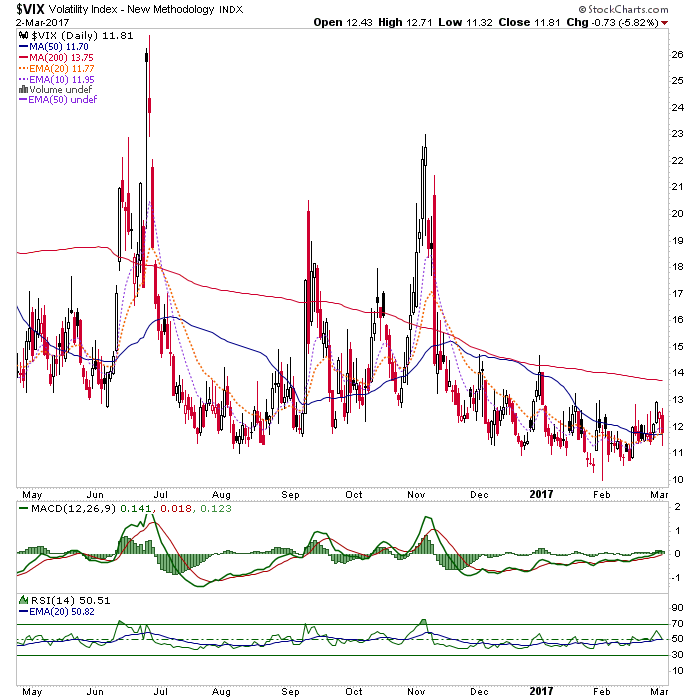
The VIX (volatility index) was conspicuous in its strength 2 days ago when the stock market blasted upward on nothing but future fiscal economic dreams. Yesterday, curiously, it was negative on a down day for the market. Both instances were atypical. Regardless, VIX has been negatively diverging the stock rally for the last month in remaining firm, now at the SMA 50. Buying volatility (or shorting the lack of it) looks like a good hedge right now.
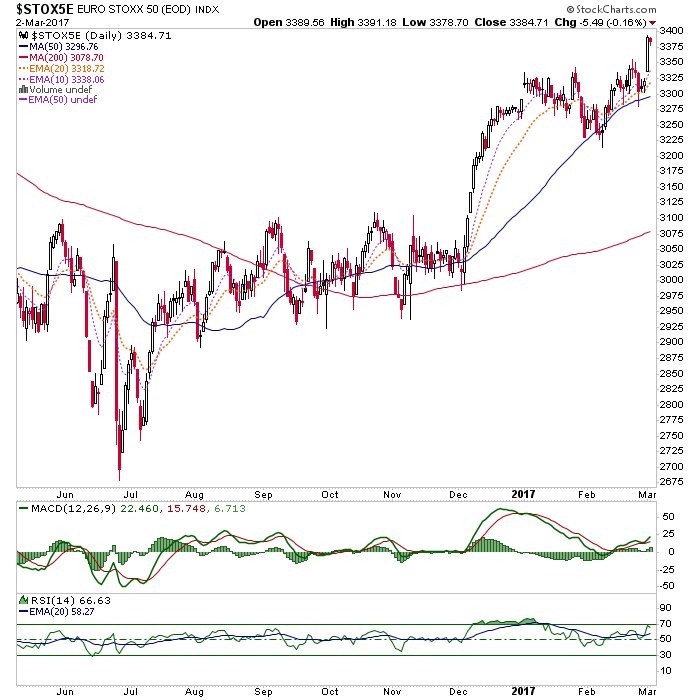
The Euro STOXX 50 is breaking upward from a sweet little daily pattern, which measures to around 3460. Resistance (not shown on the daily chart) comes into play at 3500.
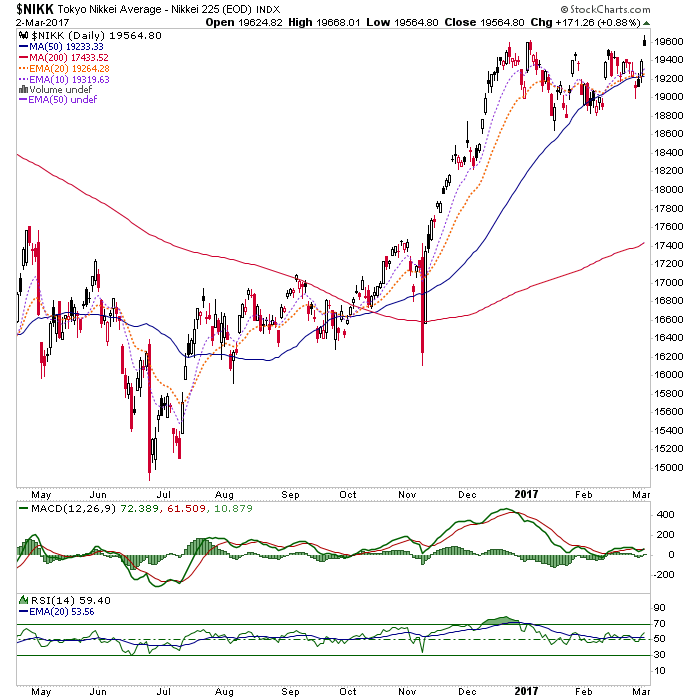
Japan’s Nikkei is breaking upward as the Yen, and its bearish daily chart, break down. No surprise there. I ended my Japan trade quite a while ago as the DXJ ETF came toward target. But a Yen breakdown would increase interest here.
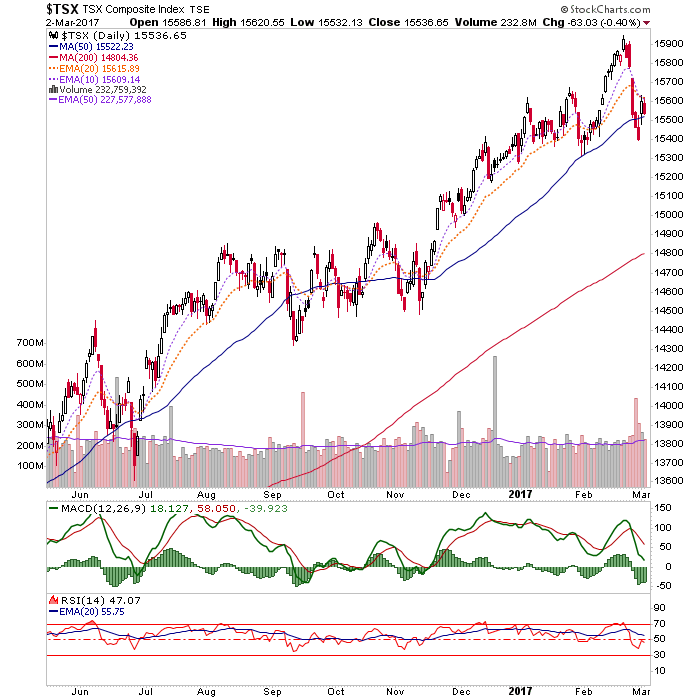
Canada took a hard down but recovered the SMA 50. Not an inspiring chart with RSI below 50. A break above the short-term moving averages would help the situation.
Emerging Markets are looking ugly with RSI red, MACD rolling over and the price below the short-term moving averages. The ‘W’ pattern target was 38, so that is no longer in the mix for an upside objective. A ratio chart we routinely review in NFTRH has shown no reason to favor EMs over U.S. stocks, even when EEM was rising. Now, they are just an ‘avoid’.


Leave A Comment