Exactly 1 month ago we NFTRH+’d the Transports iShares, IYT using a daily chart to gauge the buy point and the weekly to project the sell point, per this updated chart.Boink, it came within 14 pennies.

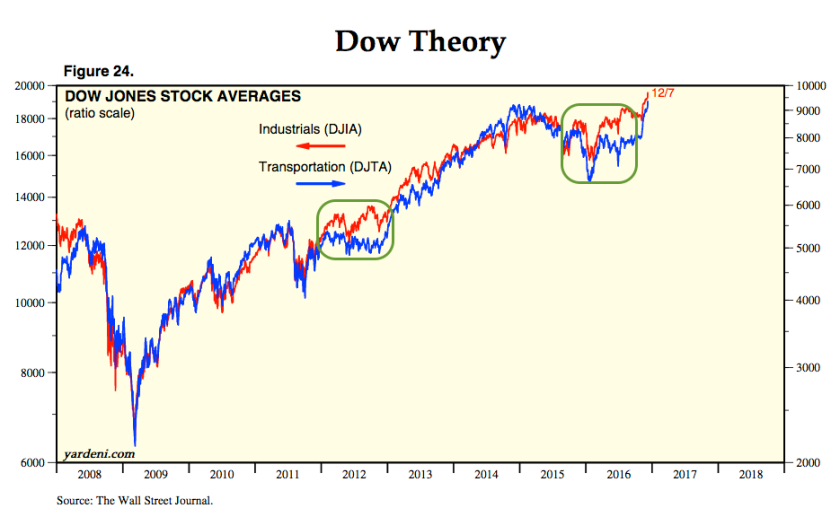
More than crowing about a successful NFTRH+ trade I’d also note that many Dow Theorists have been bearish the US stock market due to a divergence of the Tranny to the Industrials. Well, as things stand now that divergence is all gone. Using the $TRAN index, the 2014 high was 9310 and it closed yesterdasy at 9421. Let’s see what the weekly close brings today.
The greater point is that the Dow Theorists and every other one of us who think we can report markets to you using charts have got to be really careful about speaking too authoritatively. Because each of the various disciplines have a funny way of not working at key times. As for our venerable Theorists, we have been noting for months now that a similar negative divergence took place in 2012, which resolved very bullish. Here is the Yardeni.com chart we have used all along (w/ my markups)…


Leave A Comment