Concern Or Showstopper?
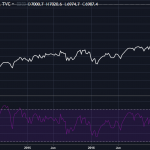
The S&P 500 is a capitalization-weighted index, meaning larger companies carry a larger percentage weighting. An equal-weighted S&P 500 Index (RSP) looks at all 500 components equally. Therefore, when RSP lags the S&P 500 (SPY), it tells us that the S&P 500 is being lead by the larger companies in the index and some of the smaller companies are lagging (see 2015 chart below). Therefore, the RSP/SPY ratio is another way to track market breadth or participation in a stock market advance. It is easy to see RSP has been and continues to lag in 2015.

What Does History Tell Us?
Is it possible for the S&P 500 to advance for a significant period time when RSP is lagging SPY? Said another way, is a downtrend in the RSP/SPY ratio a showstopper for the S&P 500 rally? In 2006, the RSP/SPY ratio was falling; during the same period the S&P 500 gained almost 5%.

In 2007, the RSP/SPY ratio was falling; during the same period the S&P 500 gained almost 13%. The divergence lasted for roughly four months.

In 2011-2012, the RSP/SPY ratio was falling; during the same period the S&P 500 gained over 28%. The divergence was in place for eight months.

Is market leadership by the largest companies a rally killer? History says no. All things being equal, we prefer to see a more robust RSP/SPY ratio. The ratio is relevant, just not a good timing tool when viewed in isolation.
Breadth May Be Ready To Improve
As noted via a November 3 tweet, it is possible the current rally is on the verge of broadening out (having a greater percentage of stocks provide leadership).


Leave A Comment