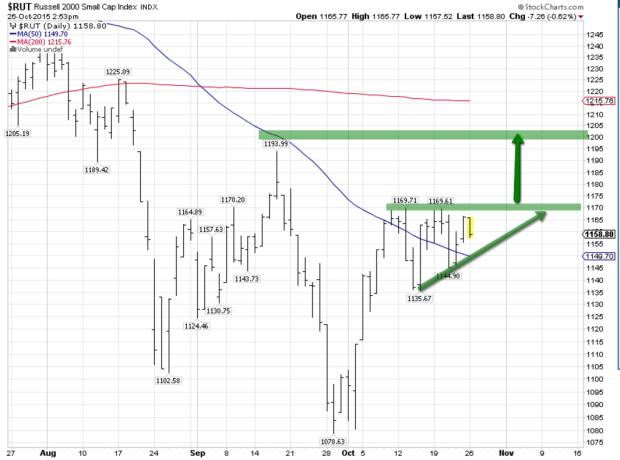
Three out of the four major market averages pushed above their 200 day moving average during last week’s rally. Meanwhile the Russell 2000, or small caps index, has lagged behind and is still about 5% away from its 200 day (red line).
However it looks like the Russell is in a bull flag pattern, with two higher lows (1135 and 1144) and two highs at 1169. A break above 1169 would confirm this pattern and likely send the Russell above the prior swing high at 1193 and possibly up to the 200 day at 1215.

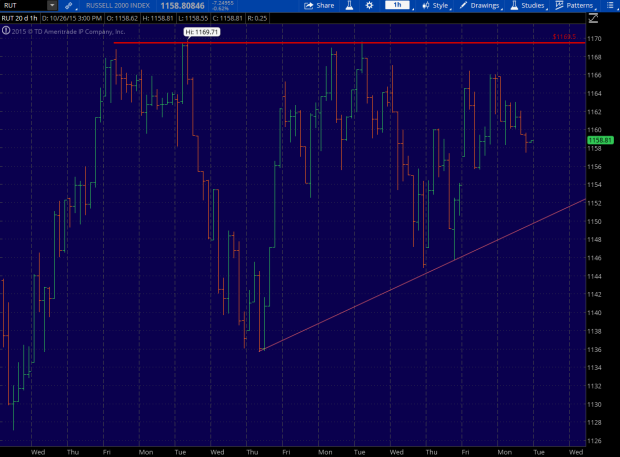
A closer look at price action shows the trendline coming in around 1150. A break below the trend line would invalidate the pattern and setup for some more downside.
In totality it’s been an amazing run off the late September lows. The S+P 500 has gained about 10% just in the last 2-3 weeks. And even though there bound to be a temporary break or pause at some point in the near future, new bull market highs look inevitable.
Apple reports earnings tomorrow and the Fed’s FOMC statement on Wednesday should keep investors busy.


Leave A Comment