A lot of angst is being felt amongst FANG investors overvaluation and buying too high right now. I don’t want to get into that debate here, but the market has a way of digesting and seeing changes in the business of the high flyers that may be hard to see through any individual’s eyes, especially if he is staring at a stock chart that seemingly has climbed all out of control. I just want to note something strictly from a technical perspective from the combined wisdom of all market participants. This, by the way, is smarter than you or me.
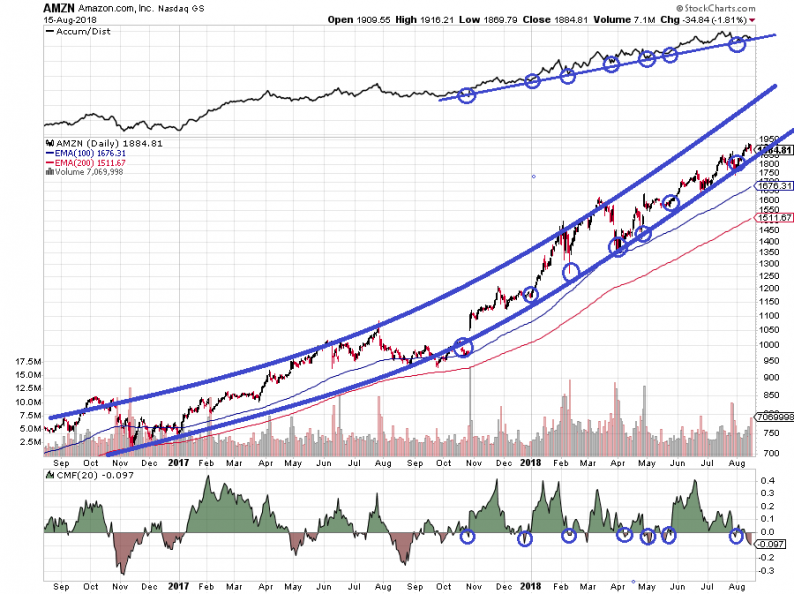
Let’s look at Amazon’s chart and see how overbought it really is:

At first glance, it would seem to be all out of control to the upside. If you’re going to buy it, you have to wait for a big pullback, right? But if you assume there is a change in climb steepness, related to some fundamental changes in their business, and you construct the trading channel change in slope associated with that, you see that it doesn’t look so overbought. It is, in fact, resting on the bottom of the new channel preparing for the next run to the top.
I’ve also included the Accumulation/Distribution cycling for this channel along with the CMF money flow cycling. These weigh the considered opinion of what I call the “heavy” money – large funds and other very large pools of cash, which tend to do the best research. I find that these have very good predictive power in moving the needle when the cycling correlates well with runs in the stock. As the chart shows, there is a very good correlation for Amazon now. Virtually every trip the A/D support trend line corresponds to the beginning of a good run to the upside for the stock, and we are smack on one right now. All this suggests AMZN is actually at a good buy point, even after the run it has had this year – it may just be changing gears.
This isn’t the first time this kind of thing has happened. If you look at the following chart, you see a very similar situation:

Related Posts
 Intro Guide To The Putnam High Yield A Fund (PHIGX)
- Democratic Or Republican: Which President Is Better For The Financial Markets?
 Stocks For You To Swing-Trade: GOOGL, HAL, CMA
 Forex Strength And Comparison For Week 18 / 2017
- Bi-Weekly Economic Review: Embrace The Uncertainty
 E
Elliott Wave Analysis: 10 Year US Notes Pointing At The 131.107 Resistance Area
E
Elliott Wave Analysis: 10 Year US Notes Pointing At The 131.107 Resistance Area


Leave A Comment