Canada, like the U.S., has two major sources of survey information with respect to labor market developments. One data source is the familiar monthly survey of households (LFS), the other source is the employer survey of payrolls (or SEPH).
As in the U.S, both surveys will show monthly changes in employment, but only the LFS provides estimates of labor force participation, the unemployment rate and the duration of unemployment.
And as in the U.S., the two surveys do not always provide the same kind of information.
Making matters even worse in the Canadian case, the employer survey (SEPH) is published several months after the household survey. Indeed, this is one major reason the SEPH survey is often ignored when it comes to tracking labor market developments.
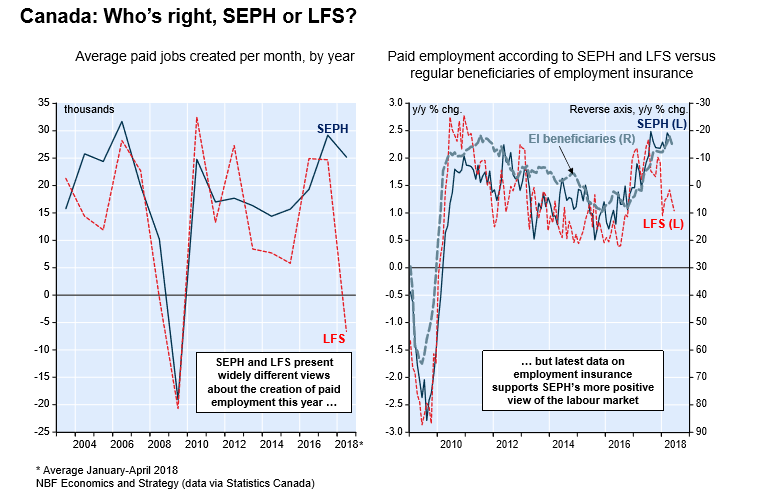
As a July 19th National Bank report indicates, the two Canadian surveys are providing somewhat different portrayals of the Canadian job market this year.
The more familiar Labour Force Survey (LFS) indicates that between January and April of this year Canada lost jobs, while the paid employment survey (SEPH) indicates employment increased over the same time span.
Over the first four months of 2018, the SEPH report indicates that paid employment rose an average 25,000 per month, while the LFS reported an average loss of 7000 jobs per month.
As is usual, the difference is a bit confusing, and the question arises which survey is providing a more accurate picture of Canada’s job market.
This writer concurs that the SEPH data is probably portraying a more accurate picture, but of course, the SEPH data is a bit dated, and as well, it refers only to paid employment and doesn’t cover self-employment.
Nonetheless, as the National Bank chart illustrates, the SEPH data is consistent with the reported decline in the number of regular beneficiaries of employment insurance.


Leave A Comment