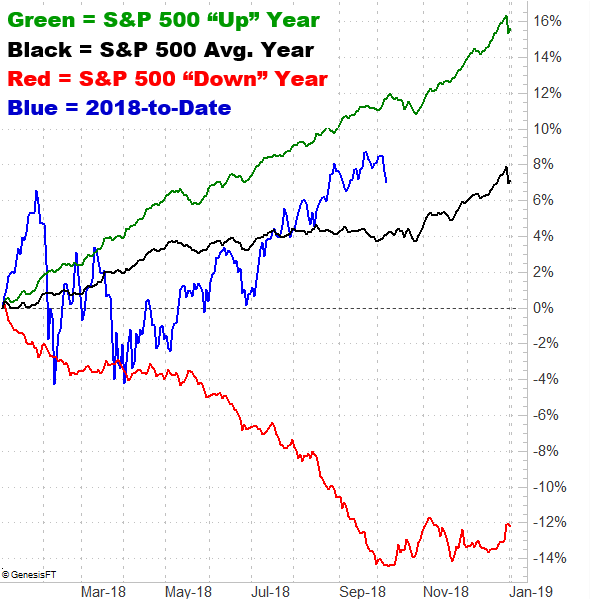
Most traders recognized the market was overbought and ripe for some profit-taking at the beginning of last week. Most traders, however, didn’t appear to think it would actually happen. Last week, the S&P 500 lost almost 1.0% of its value… the worst week since June.
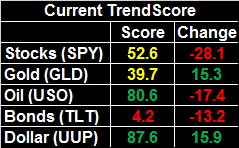
And yet, as rough as last week was, it wasn’t devastating. The market took a hit, but when push came to shove the S&P 500 remains above one key line in the sand, while the VIX remains below an important technical ceiling. It’s still overbought, but it’s still holding most of its ground.
We’ll identify that support and resistance below, and offer up some likely outcomes from here. First though, let’s paint a bigger picture with a look at last week’s and this week’s economic data.
Economic Data
There’s no reason to ignore the 800 pound gorilla in the room. Friday’s jobs report for September was a head-turner. But, let’s save that look for a grand finale, and instead run through last week’s economic news in order of appearance.
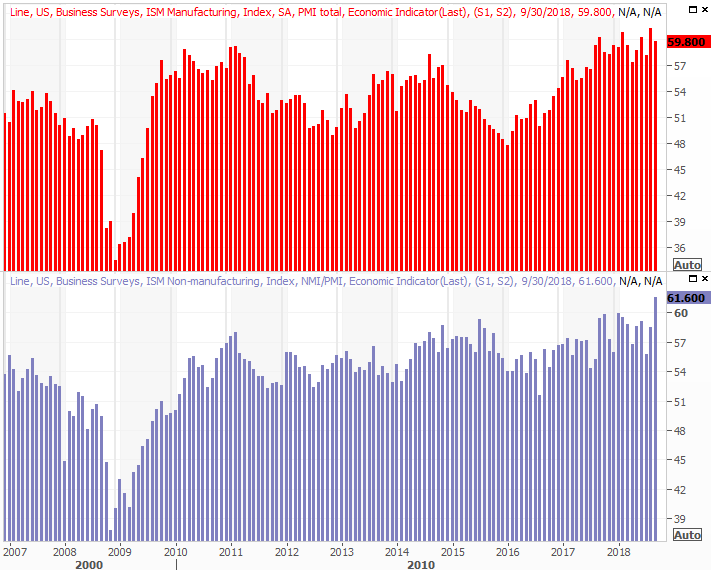
That puts last month’s ISM Manufacturing Index report first in the queue, rounding out the ISM Services Index update from a week earlier. And, unlike the ISM Services report, the manufacturing version of the data not only fell for the month, it came in below expectations.
ISM Index Charts
Source: Thomson Reuters
It’s not a problem yet, but it’s something to watch. We’d really rather see progress on the manufacturing front rather than the services front.
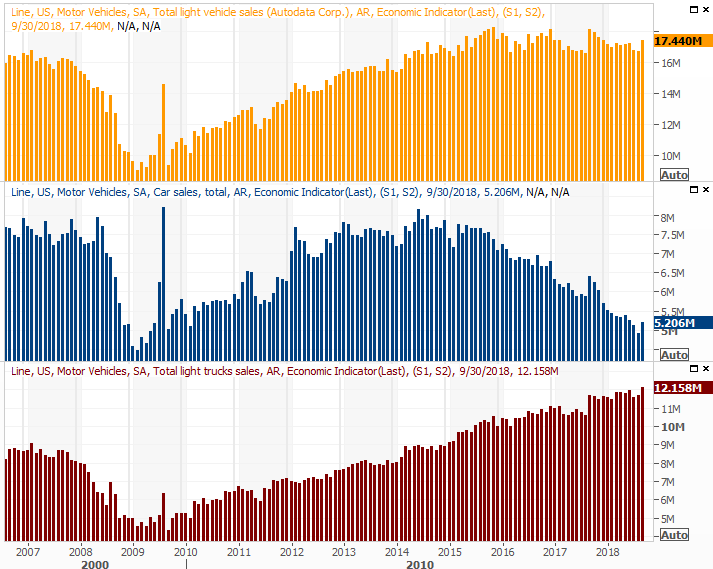
Take Tuesday’s big automobile sales figures with a grain of salt. They were up from August’s numbers, but some of that perk-up may have been the initial purchases stemming from insurance reimbursements. Hurricane Florence wasn’t devastating, but it certainly wasn’t minor either.
Automobile Sales (Annualized) Charts
Source: Thomson Reuters
If history is any guide, that surge won’t last long, allowing the auto sales trend to resume its broad downtrend that’s been in place since 2016.



Leave A Comment