
The headlines say construction was unchanged month-over-month but was on the lower end of expectations. The rolling averages improved.

Analyst Opinion of Construction Spending
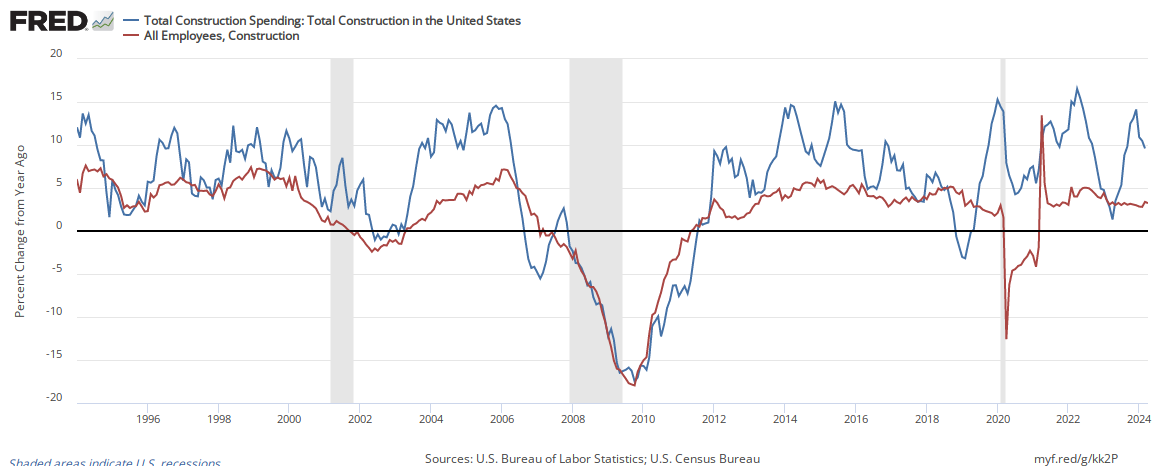
The rolling averages improved – and last month was moderately revised upward. Also, note that inflation is grabbing hold.
The employment gains currently are generally correlating with construction spending.
Econintersect analysis:

US Census Analysis:
Construction spending (unadjusted data) was declining year-over-year for 48 straight months until November 2011. That was four years of headwinds for GDP.

This month’s headline statement from US Census:
Construction spending during September 2018 was estimated at a seasonally adjusted annual rate of $1,329.5 billion, nearly the same as (±1.5 percent)* the revised August estimate of $1,328.8 billion. The September figure is 7.2 percent (±1.8 percent) above the September 2017 estimate of $1,240.4 billion. During the first nine months of this year, construction spending amounted to $982.9 billion, 5.5 percent (±1.2 percent) above the $931.3 billion for the same period in 2017.
PRIVATE CONSTRUCTION – Spending on private construction was at a seasonally adjusted annual rate of $1,020.4 billion, 0.3 percent (±1.0 percent)* above the revised August estimate of $1,016.9 billion. Residential construction was at a seasonally adjusted annual rate of $556.4 billion in September, 0.6 percent (±1.3 percent)* above the revised August estimate of $553.4 billion. Nonresidential construction was at a seasonally adjusted annual rate of $463.9 billion in September, 0.1 percent (±1.0 percent)* above the revised August estimate of $463.5 billion.
PUBLIC CONSTRUCTION – In September, the estimated seasonally adjusted annual rate of public construction spending was $309.1 billion, 0.9 percent (±2.6 percent)* below the revised August estimate of $312.0 billion. Educational construction was at a seasonally adjusted annual rate of $74.6 billion, 1.2 percent (±3.1 percent)* above the revised August estimate of $73.7 billion. Highway construction was at a seasonally adjusted annual rate of $95.2 billion, 1.1 percent (±6.9 percent)* below the revised August estimate of $96.2 billion.

Related Posts
 VGX, PERP and LUNA rally while Bitcoin price struggles to hold $38K
 What Comes Next: Previews Of The Coming Reckoning
 This Is The Only Chart Americans Should Be Worrying About Right Now
- Gold Prices May Continue To Fall After Largest Drop In 2 Months
 E
Market Briefing For Tuesday, Dec. 12
E
Market Briefing For Tuesday, Dec. 12 What Bubble? Are Giant Startups Really An Indicator Of A Bubble?


Leave A Comment