The United States equity markets and the cryptocurrency space are witnessing a relief rally this week. Supporting the rise in risky assets is the U.S. dollar index (DXY), which retreated from its multi-year high. Generally, cryptocurrencies move inverse to the price of the U.S. dollar, but this week’s bounce does not necessarily mean that bulls’ grip over the market has come to an end.
Citing on-chain data, CryptoQuant senior analyst Julio Moreno, said that Bitcoin (BTC) miners may have already capitulated. Historical data suggests that miner capitulation usually precedes market bottoms.
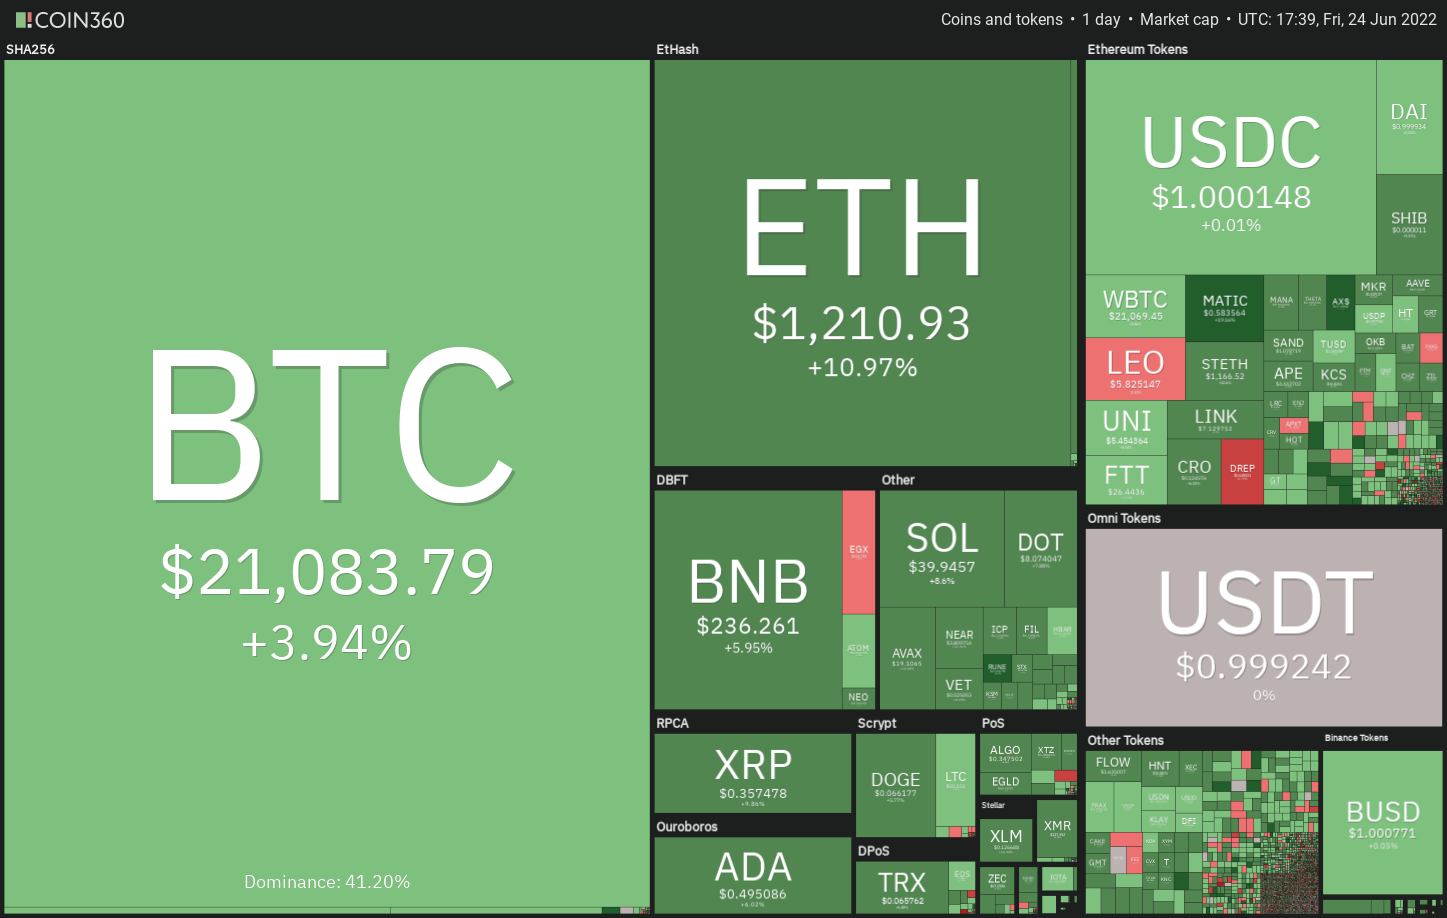
Several on-chain indicators are suggesting that Bitcoin may be close to a bottom. Let’s study the charts of the top-10 cryptocurrencies to find out what the technicals suggest?
BTC/USDT
Bitcoin is attempting a recovery in a downtrend but the bulls are struggling to push the price to the 38.2% Fibonacci retracement level of $23,024. This suggests that demand dries up at higher levels.
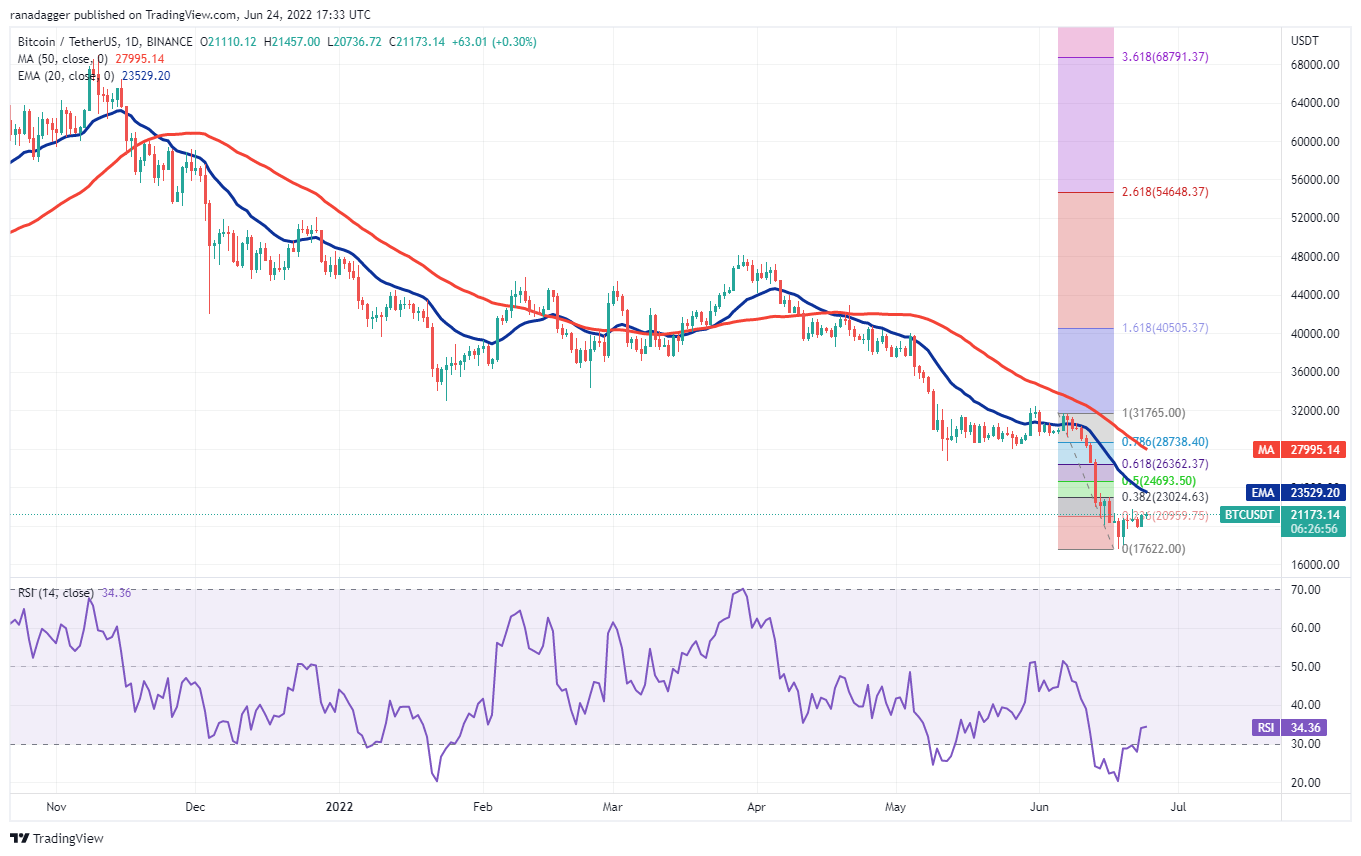
If the price turns down sharply from the 20-day EMA, it will suggest that the bears are in command. The sellers will then make another attempt to sink the BTC/USDT pair to the crucial level at $17,622.
Conversely, if buyers propel the price above the 20-day EMA, it will suggest that the bears may be losing their grip. That could open the doors for a possible rally to the 50-day simple moving average ($27,995).
ETH/USDT
Ether (ETH) had been trading between $1,200 and $1,050 since June 20. This tight range trading resolved to the upside on June 24 as bulls attempt to push the price to the 20-day EMA ($1,332).

The bears will then try to pull the price to $1,050. A break and close below this support could retest the vital support at $881.
Alternatively, if bulls drive the price above the 20-day EMA, the likelihood of a rally to the breakdown level of $1,700 increases.
BNB/USDT
The bears tried to pull Binance Coin (BNB) below $211 on June 22 but the bulls held their ground. This started a relief rally which has reached the 20-day EMA ($243).

Another possibility is that the price turns down sharply from the 20-day EMA. If that happens, the bears will try to pull the pair below $211 and challenge the June 18 intraday low of $183. A break below this support could indicate the start of a downtrend to $150.
XRP/USDT
The tight range trading in Ripple (XRP) resolved to the upside with a break above the 20-day EMA ($0.35) on June 24. This suggests that the bears may be losing their grip.
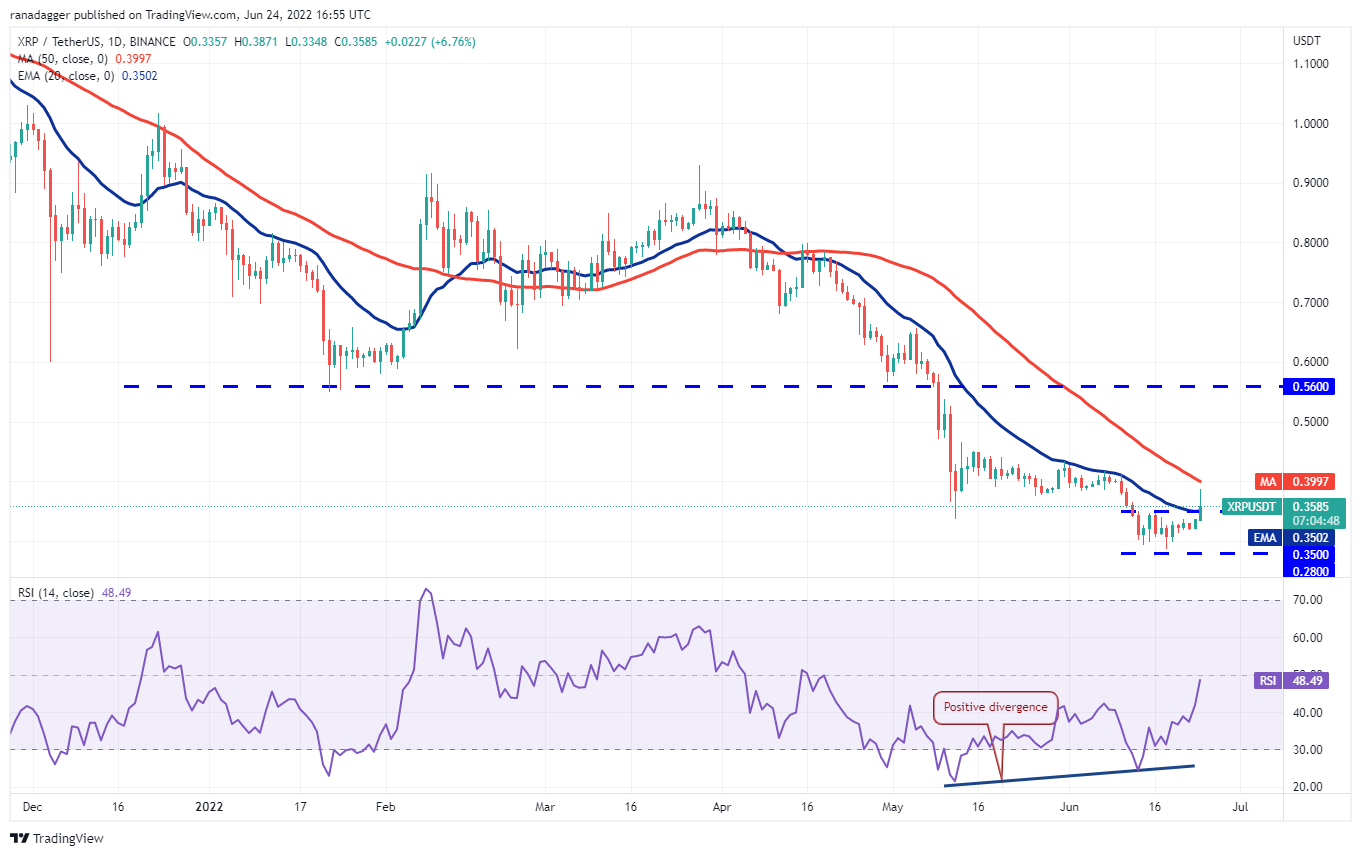
Contrary to this assumption, if the price turns up and breaks above the 50-day SMA, it will suggest the start of a new up-move. The pair could first rally to $0.46 and then make a dash toward $0.56.
ADA/USDT
Cardano (ADA) has been oscillating between the 20-day EMA ($0.50) and the strong support of $0.44 for the past few days but this tight range trading is unlikely to continue for long.
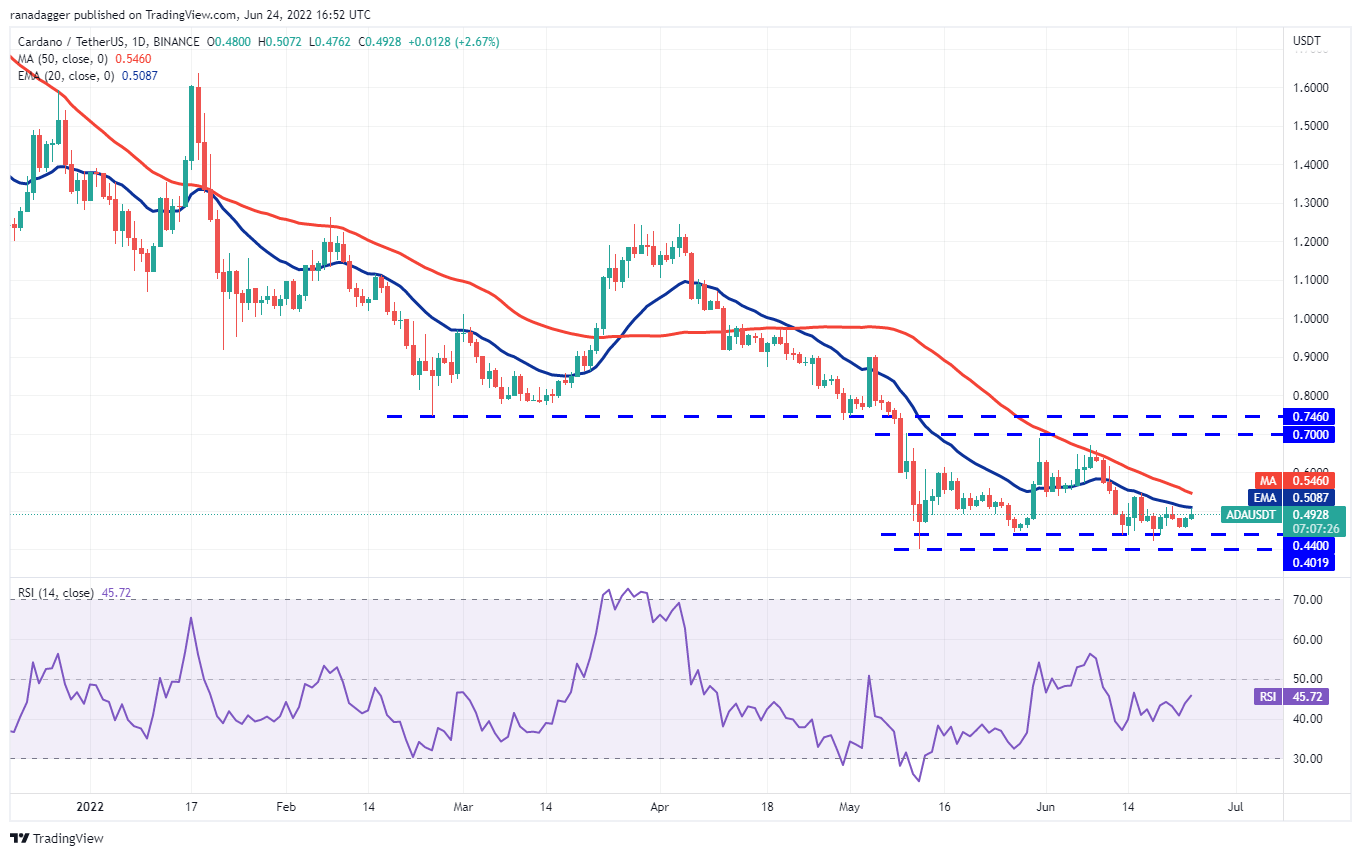
Contrary to this assumption, if the price turns down from the 20-day EMA, it will suggest that bears are defending the level aggressively. The sellers will then try to pull the pair below the strong support zone of $0.44 to $0.40 and resume the downtrend.
SOL/USDT
Solana (SOL) turned down from the 20-day EMA ($36) on June 22 but the bears could not sustain the lower levels. The bulls purchased the dip and pushed the price back above the 20-day EMA on June 23.

Contrary to this assumption, if the price fails to sustain above the 20-day EMA, it will suggest that bears are active at higher levels. If sellers pull the price below $33, the pair could slide to $27.
DOGE/USDT
Dogecoin (DOGE) has been trading near the 20-day EMA ($0.06) since June 21. This suggests that the bulls are not closing their positions as they anticipate a break above the 20-day EMA.

If bulls thrust the price above the 20-day EMA, the DOGE/USDT pair could rally to the 50-day SMA ($0.08) where the bears may again pose a strong challenge. The bulls will have to clear this hurdle to open the doors for a possible up-move to $0.10.
Alternatively, if the price turns down from the 20-day EMA, the bears will try to pull the pair below $0.06 and challenge the psychological support at $0.05.
Related: Bitcoin gives ‘encouraging signs’ — Watch these BTC price levels next
DOT/USDT
Polkadot (DOT) bounced off the $7.30 support on June 23 indicating that bulls are attempting to form a higher low. The price has reached the 20-day EMA ($8.15), which is an important barrier for the bulls to overcome.

This level may again act as a strong resistance and if the price turns down from it, the pair could remain stuck between $12.44 and $7.30 for a few days. The bears will have to sink the price below the $7.30 to $6.36 support zone to indicate the start of the next leg of the downtrend.
SHIB/USDT
The bears tried to pull the price below the 20-day EMA ($0.000009) on June 22 but the bulls held their ground. Shiba Inu (SHIB) rebounded off the 20-day EMA on June 23 but the buyers could not push the price above the 50-day SMA ($0.000011).
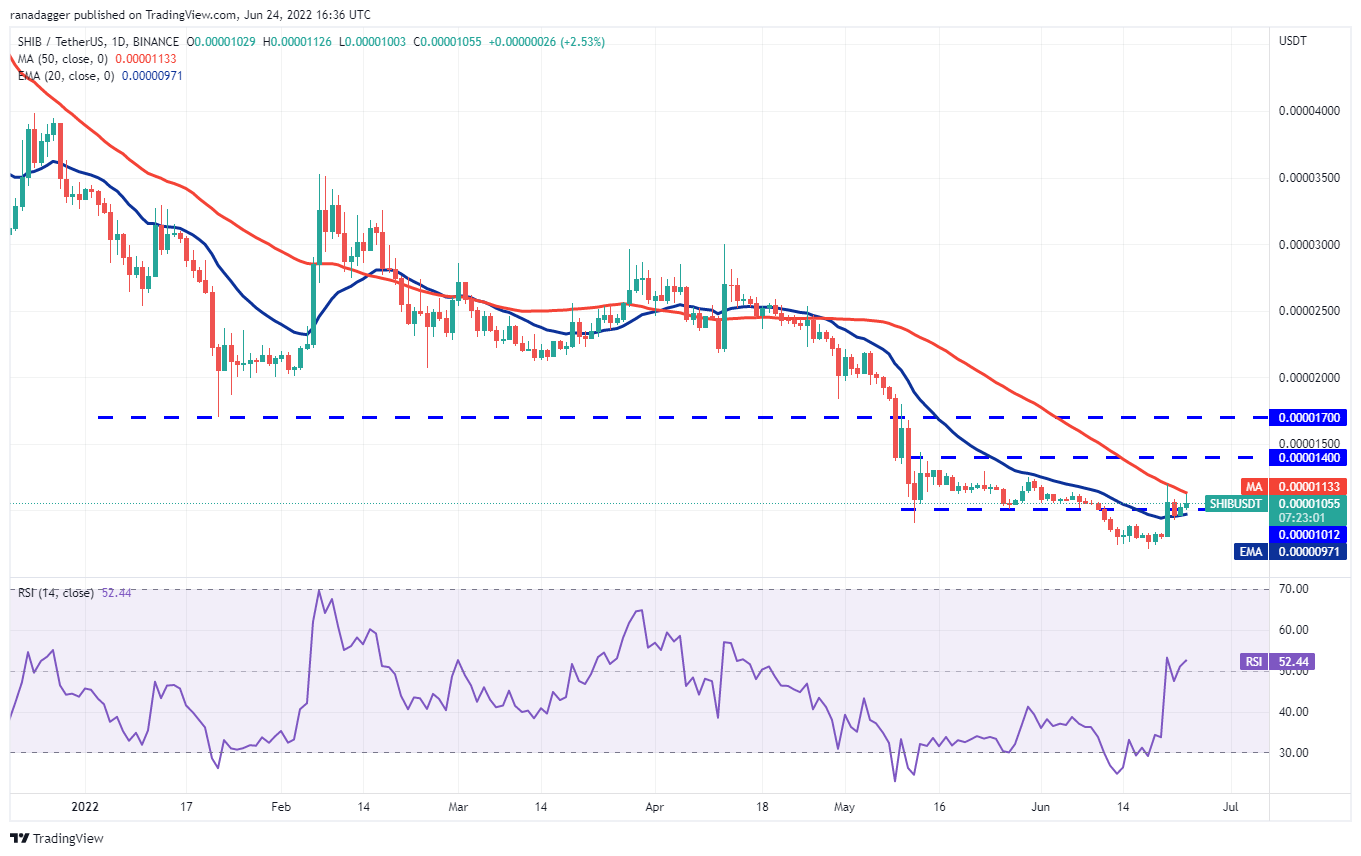
Conversely, if the price turns down and plummets below the 20-day EMA, it will suggest that bears have gained the upper hand. The pair could then slide to $0.000008.
LEO/USD
UNUS SED LEO (LEO) repeatedly rose above the resistance line of the descending channel between June 22 and June 24 but the bulls could not sustain the higher levels.

That could pull the price to the 20-day EMA ($5.39). If the price rebounds off this support, the bulls will again attempt to push the LEO/USD pair above the channel. If they succeed, the next stop could be $6.50 and then $6.80.
On the contrary, if the price turns down and breaks below the 20-day EMA, it will suggest that the pair may remain stuck inside the channel for a few more days.
The views and opinions expressed here are solely those of the author and do not necessarily reflect the views of Cointelegraph. Every investment and trading move involves risk. You should conduct your own research when making a decision.
Market data is provided by HitBTC exchange.


Leave A Comment