The gold volatility index moved to a new all-time low and there was no meaningful action in gold recently. Well, we profited on the decline and on the following upswing, but the price action that we saw was nothing to call home about. For months, gold has been moving around the $1,300 level and it’s trading relatively close to it also today. But, will this action persist for much longer? Not likely. It seems that something is about to hit the fan.
Before this week, there were many signs pointing to lower prices of precious metals in the following weeks, but not necessarily in the following days. This week, we are finally seeing the bearish short-term confirmations. We discussed them yesterday and in today’s analysis, we provide a big update.
Let’s start with the gold chart (charts courtesy of http://stockcharts.com).

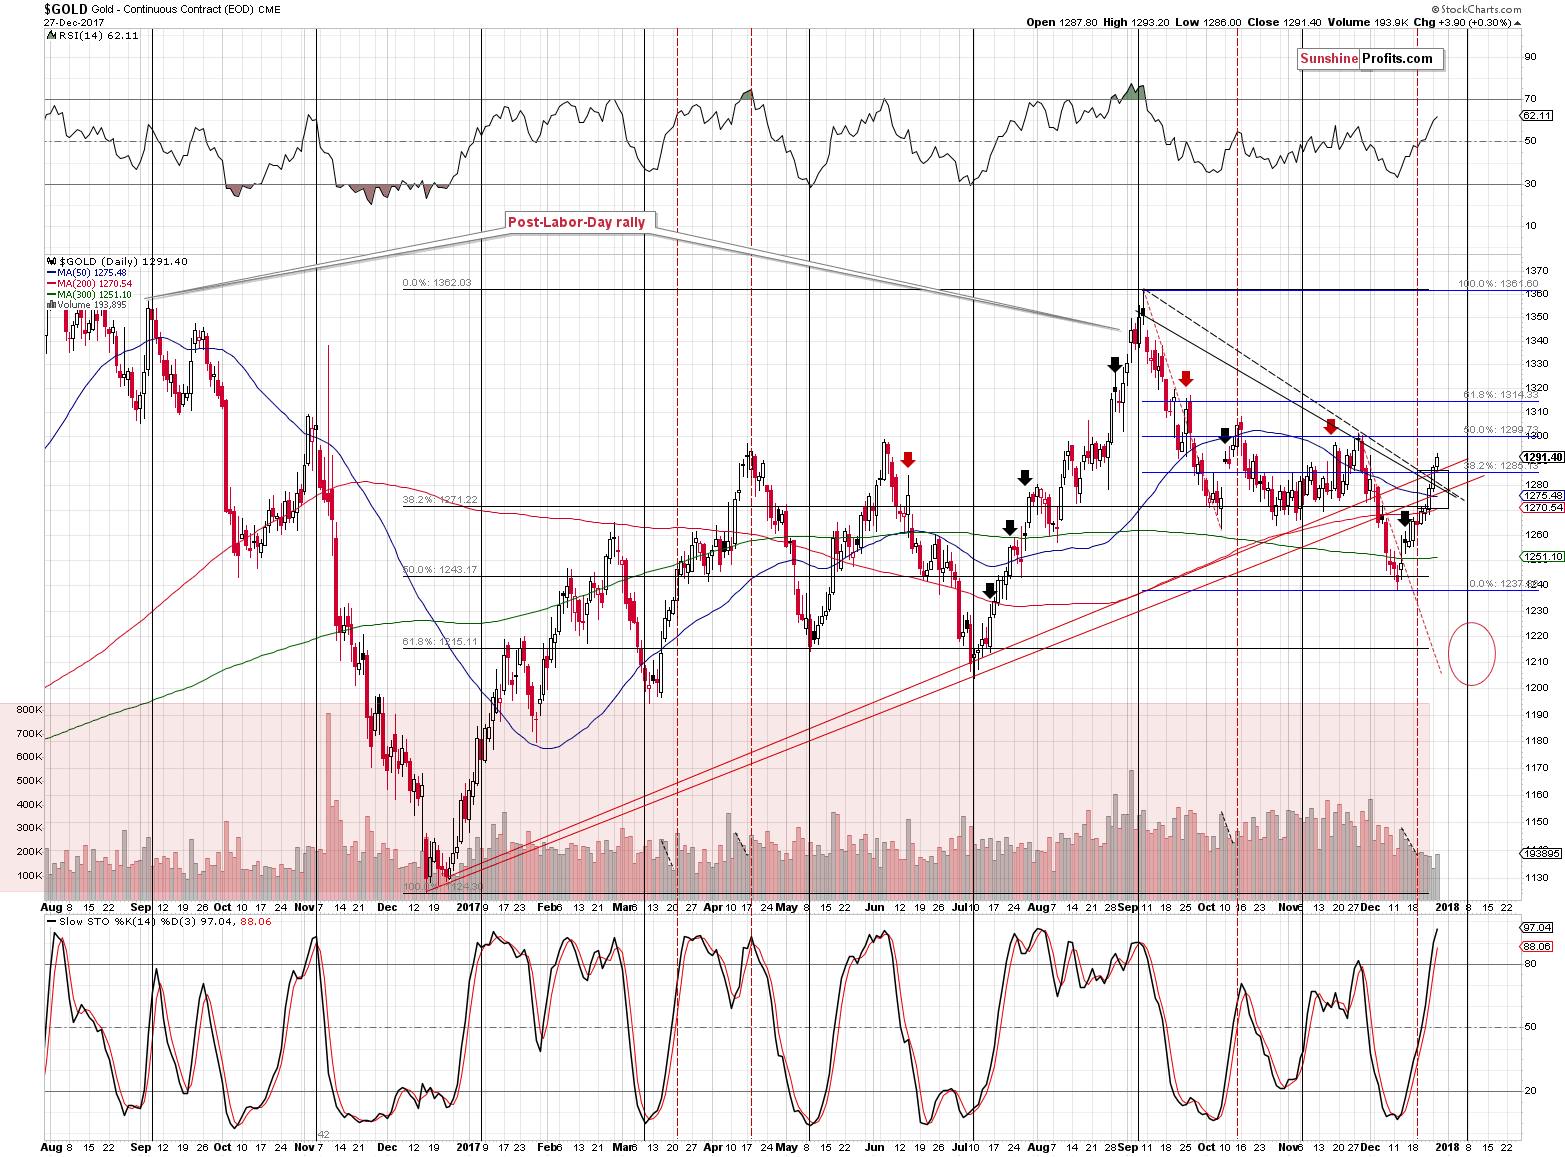
Gold moved above the combination of resistance levels, but it doesn’t seem to be a big deal. The reasons are the proximity of another combination of resistance levels just several dollars higher and the fact that we have multiple other bearish indications in place.
As far as the combination of resistance levels is concerned, we have the 50% Fibonacci retracement, the November and (approximately) October highs and the psychologically important $1,300 level.
In terms of time, we have the apex of the triangle based on the intraday extremes (declining black dashed line and the lower of the rising red lines) pointing to a turning point at the end of the year. We also have gold’s turning point around January 8th. Given silver’s outperformance and miners’ small decline that we saw yesterday, it seems that the former time target is more likely to mark the final top for this corrective upswing. This is particularly the case since we saw a turning point in the first days of 2017 but the bottom actually formed in December.
So, it seems that the end of the year might also mark the end of gold’s rally.
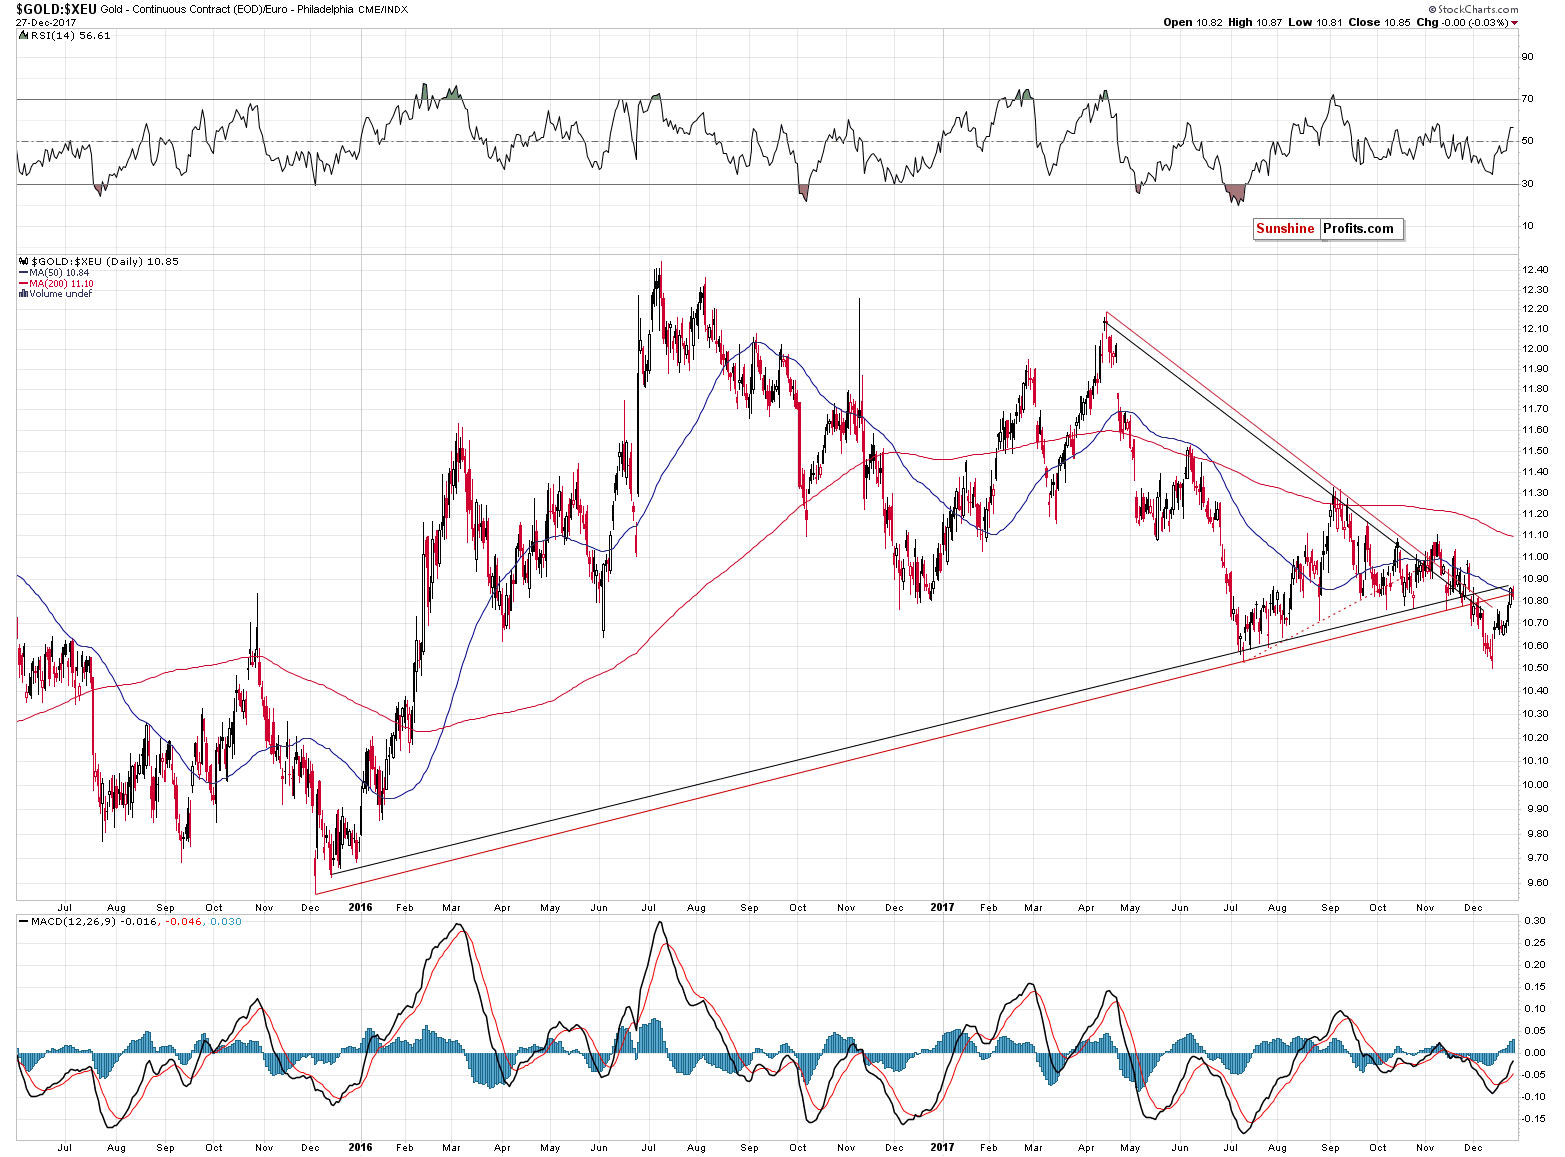
Also, there was no breakout above the rising resistance lines in the case of gold priced in terms of the euro.

The yellow metal remains below the rising resistance lines, so the implications remain clearly bearish.
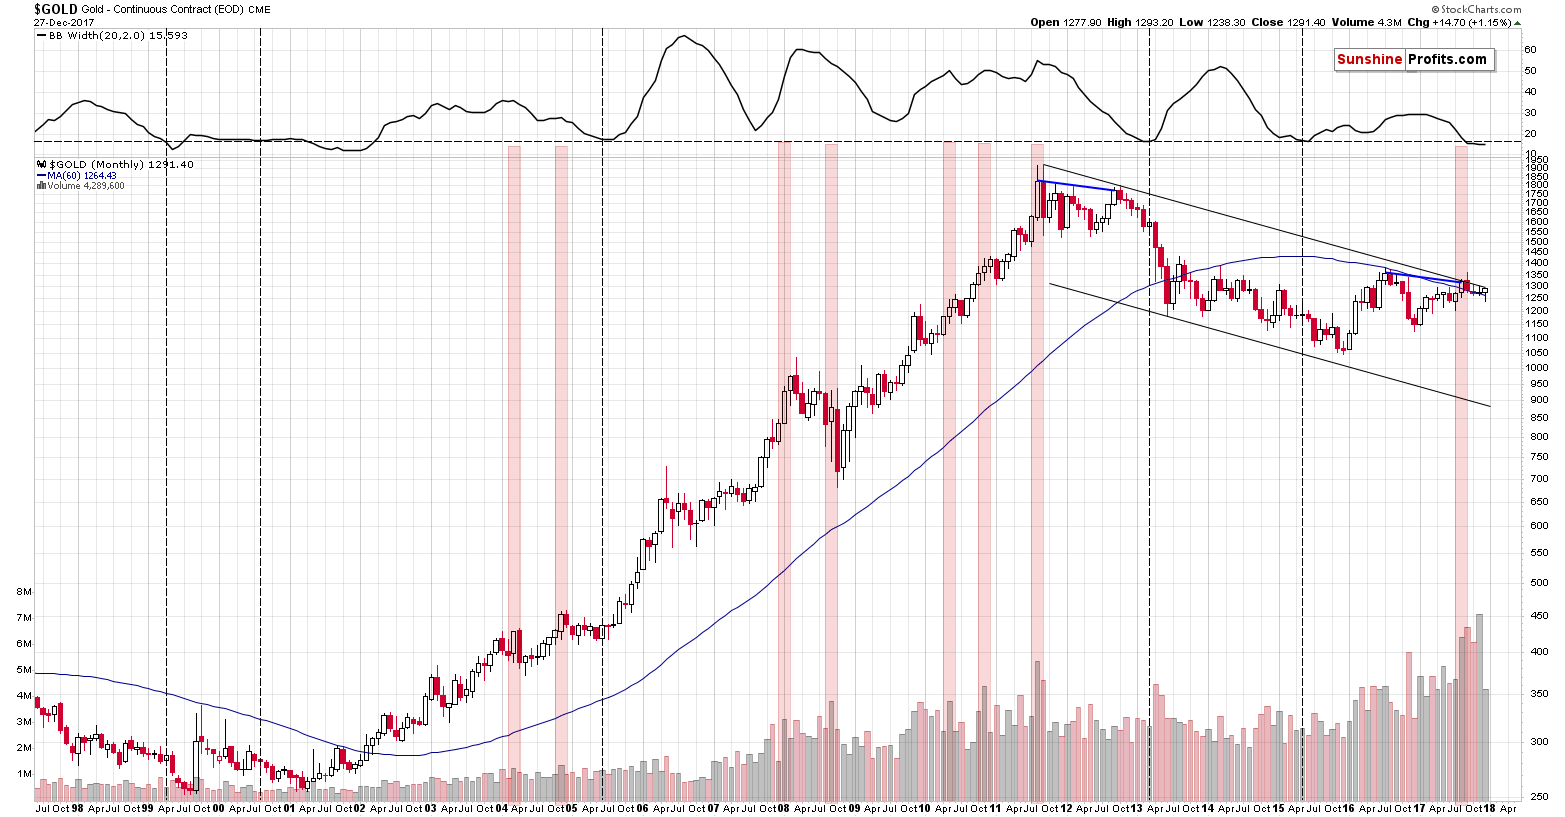
In terms of the monthly price changes, the current situation in gold became even more critical.

In yesterday’s alert, we wrote the following:
We described the analogy multiple times, but the key thing about the analogy is still right in front of us. The long-story-short version is this: the blue lines that connect the two key tops before the slide are analogous and their follow-up action is very similar as well. This makes it likely for the 2013 decline to be repeated either to the letter or on an approximate basis.


Leave A Comment