

Watch the free-preview video below extracted from the WLGC session before the market opens on 30 Jul 2024 to find out the following:
Video Length: 00:06:42
Market Environment
The bullish vs. bearish setup is 583 to 59 from the screenshot of my stock screener below.

Although there is no shortage of bullish setups, the current rotation from the Nasdaq 100 (and S&P 500) into the Russell 2000 stirred up volatility.Many breakout setups do not have immediate follow-through to the upside. More time is needed for supply absorption.
3 Stocks Ready To Soar7 “earning reactions” AXP setups, 3 “low-hanging fruits” KBH trade entries setups + 7 actionable setups JEF were discussed during the live session before the market open (BMO).


More By This Author:Will The Nasdaq 100’s Relief Rally Hold Or Is A Sharp Decline Inevitable?
How The Hidden Signs Of Selling Into Strength Could Shake The S&P 500
Low Volume Flag Breakout! What’s Next For S&P 500?

Related Posts
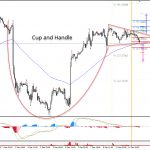 USD/CAD Cup And Handle Formation On Intraday Charts
 Bitcoin Nears $70,000 As Trump Prepares To Deliver Historic Speech At Nashville
 S&P 500, Nasdaq 100 And Russell 2000 All Defend Post-Election Breakout Last Week
 Scammers mail out fake hardware wallets to victims of Ledger data breach
 Two Charts To Consider Before The Monday Open
 3 Safe Dividend Stocks With Pristine Balance Sheets
Leave A Comment