Confusion about inflation abounds in mainstream media reporting. That confusion is a result of the fact that mainstream economists and the Fed solely focus on narrowly defined, arbitrarily constructed measures of the prices of consumer goods only. If you only look in places where there’s little inflation, or use indexes that are not standardized to measure the same goods over time, you end up ignoring the things that are inflating, and understating the inflation that does exist in consumer prices.
The Fed is largely to blame for the confusion. It has targeted a 2% inflation rate. But it uses a benchmark, the core PCE, that is the most understated of inflation measures. It ignores actual housing prices and only includes personal consumption goods. To make matters worse, when an index component is rising faster than cheaper substitutes, the index formula reduces the weighting of the goods that are rising fastest.
The thing is, the Fed is perfectly aware that it’s underreporting inflation.
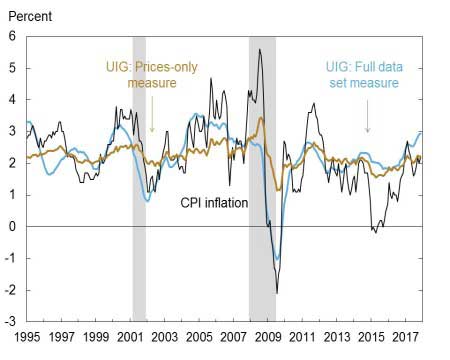
I’ve uncovered a smoking gun – well, anyway, a chart that proves they know the real numbers.
The question is – why the cover-up?
I’ve got my own theories on that (and naturally, a plan of action for you and your money).
First…The “Smoking Gun” That Shows Real Inflation At 3%, Not 2%
Even the NY Fed itself recognizes that these measures which purport to show inflation falling short of the Fed’s target, don’t reflect reality. It publishes an unknown series called the Underlying Inflation Gauge (UIG). Since 2012 it has rarely been below 2%, and it is currently at 3%.

Source: NY Fed
There it is, in black and white and tan and blue. The Fed knows. They’re just keeping very quiet about it.
Prices Are Rising Much Faster Than The Fed Would Have You Believe
The core PCE may be a measure of how fast some households’ cost of living is rising. Maybe those households do substitute similar, cheaper goods when prices rise. But how does thatmeasure actual inflation if it does not measure the same basket of goods over time? If you subtract steak and add hamburger when steak prices are rising, the result is an understatement of the inflation rate of the same goods over time.
The CPI has the same problem. In fact, the CPI was never intended to measure broad based inflation. It was intended as a basis for indexing of labor contracts and government salaries and benefits. The unstated goal has always been to keep those increases to a minimum.
On that basis, the BLS removed housing prices from the index in 1982, because raging housing inflation was pushing up CPI too fast. It substituted a measure called Owner’s Equivalent Rent (OER) that is completely ginned up. It is supposed to measure what owners think their homes would rent for.
The bottom line is that OER consistently understates the actual rate of home price inflation by at least half, and sometimes more than half. Today, that results in understating CPI by about a full point. When core CPI, excluding food and energy, rises by a reported 1.5% per year, the actual rate would be around 2.5% if house prices were included.
Moving up the inflation spectrum, we see home prices as conservatively measured by the Federal Government’s FHFA index, inflating by 36.5% since 2012. That’s 5.8% per year. The NAR’s index shows the rate even higher than that. FHFA shows the current inflation rate over the past year to be 6.4%. The NAR shows closer to 7%. It is not statistically massaged to suppress the inflation rate as the FHFA measure is.


Leave A Comment