
Crude oil prices marked time yesterday, oscillating between gains and losses intraday but never finding lasting follow-through. The spotlight now turns to the weekly set of API inventory flow data. That will be weighed up against an analogous EIA report due on the following day, which is expected to show that crude stockpiles shed 3.4 million barrels last week while gasoline storage added 1.6 million barrels.
Gold prices pushed higher as US front-end bond yields declined, bolstering the appeal of non-interest-bearing alternatives. The move seemed to mark a continuation of “fade the Fed” dynamics triggered in the wake of last week’s FOMC monetary policy announcement. Voting on US tax cut legislation may capture the spotlight from here but the outcome might be priced in already, robbing it of market-moving potential.
Gold Technical Analysis – Gold prices continue to recover, with the 50% Fibonacci retracement at 1267.81 now in the crosshairs. A daily close above that exposes the 1274.56-75.24 area (November 30 close, 61.8% level). Alternatively, a turn back below the 38.2% Fib at 1260.38 opens the door for a retest of the 23.6% retracement at 1251.18.
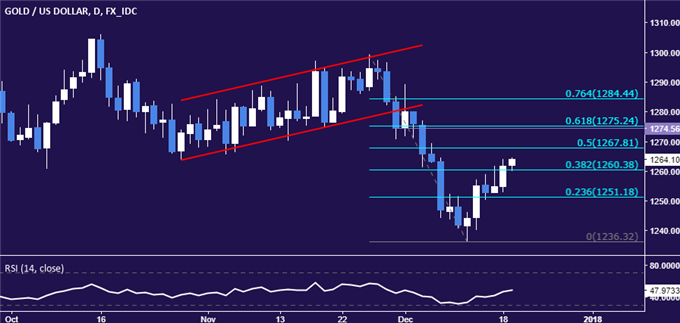
Chart created using TradingView
Crude Oil Technical Analysis – Crude oil prices remain locked within what looks like a Triangle chart pattern, a setup with bullish continuation in this scenario (if confirmed by a breakout). A daily close above the Triangle top (58.34) initially targets the 23.6% Fibonacci expansion at 59.83. Alternatively, a push below the pattern’s lower boundary (56.29) exposes the 23.6% Fib retracement at 55.04.
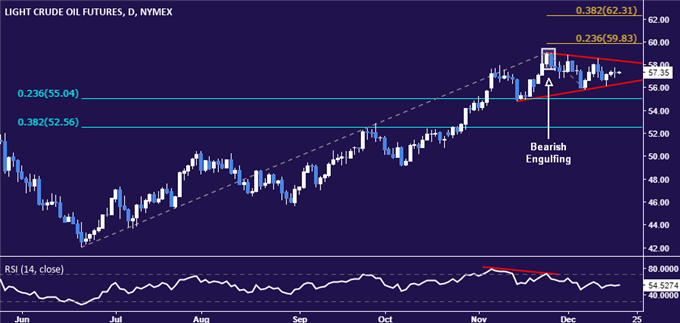
Chart created using TradingView

Related Posts
 The Most Active Equity Options And Strikes For Midday – Tuesday, Dec. 5
- Terra accidental airdrop leads to smear campaign, community member claims
 EC
The Channel Mattered
EC
The Channel Mattered Oil Falls & The GOP’s Timeline Extends Further
 Too Much Cash Could Hurt Your Retirement Savings
- FTX’s Liquid exchange hopes to return customer assets next year


Leave A Comment