As I noted last Tuesday:
“Turning points in the market, if this is one, are extremely difficult to navigate. They are also the juncture where the most investing mistakes are made.
Over the last several weeks, I have been providing constant prodding to clean up portfolios and reduce risks. I also provided guidelines for that process – click here.
For now, it is important to note the ‘bullish trend’ remains solidly intact and, therefore, we must give the ‘benefit of the doubt’ to the bulls.”
I can not emphasize that last point enough.
Portfolio management is never an “all in or out” process. It is about managing the potential risk for capital loss over time. In that regard, we have been tracking the consolidation process following the February correction.
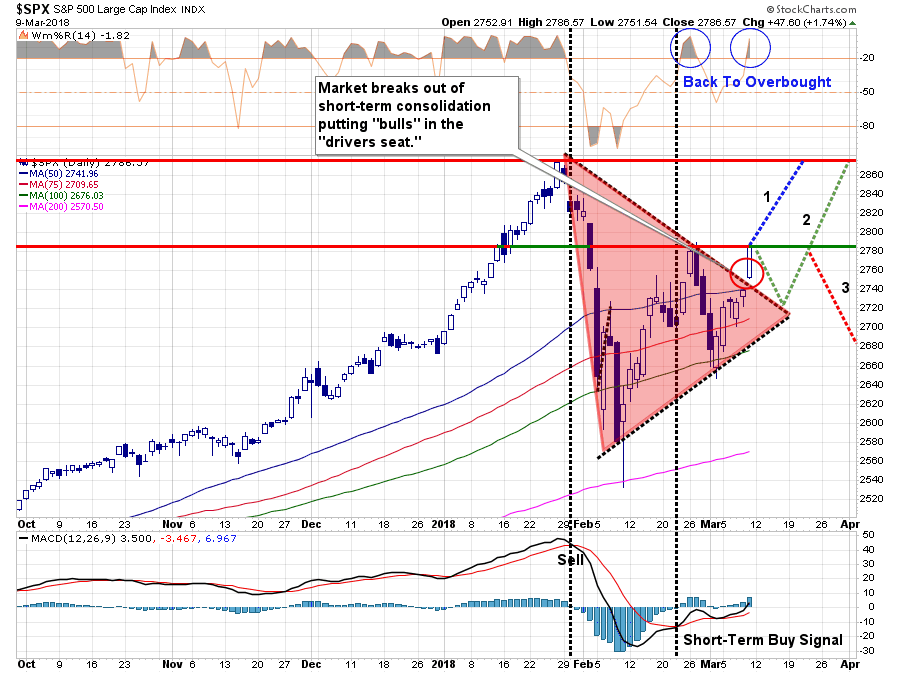
“The market is currently in the process of building a consolidation pattern as shown by the ‘red’ triangle below. Whichever direction the market breaks out from this consolidation will dictate the direction of the next intermediate-term move.”
Well, on Friday, the market made its move.

This is the third attempt to move above the 50-dma and the second attempt since registering a short-term “buy” signal in late February. This bullish backdrop kept portfolios primarily invested in equities, although we did hedge some risk last week.
The breakout of this consolidation is nothing but “bullish” in the short-term and requires us to remove our hedge and allow portfolios to run unencumbered for the time being.
The great “bear market” of 2018 officially ended on Friday…for now.
As I have notated above, there are three possibilities for the market as we wrap up the“seasonally strong” time of the year.
As I have noted, I am giving the greatest odds right now to option (1) for the time being.
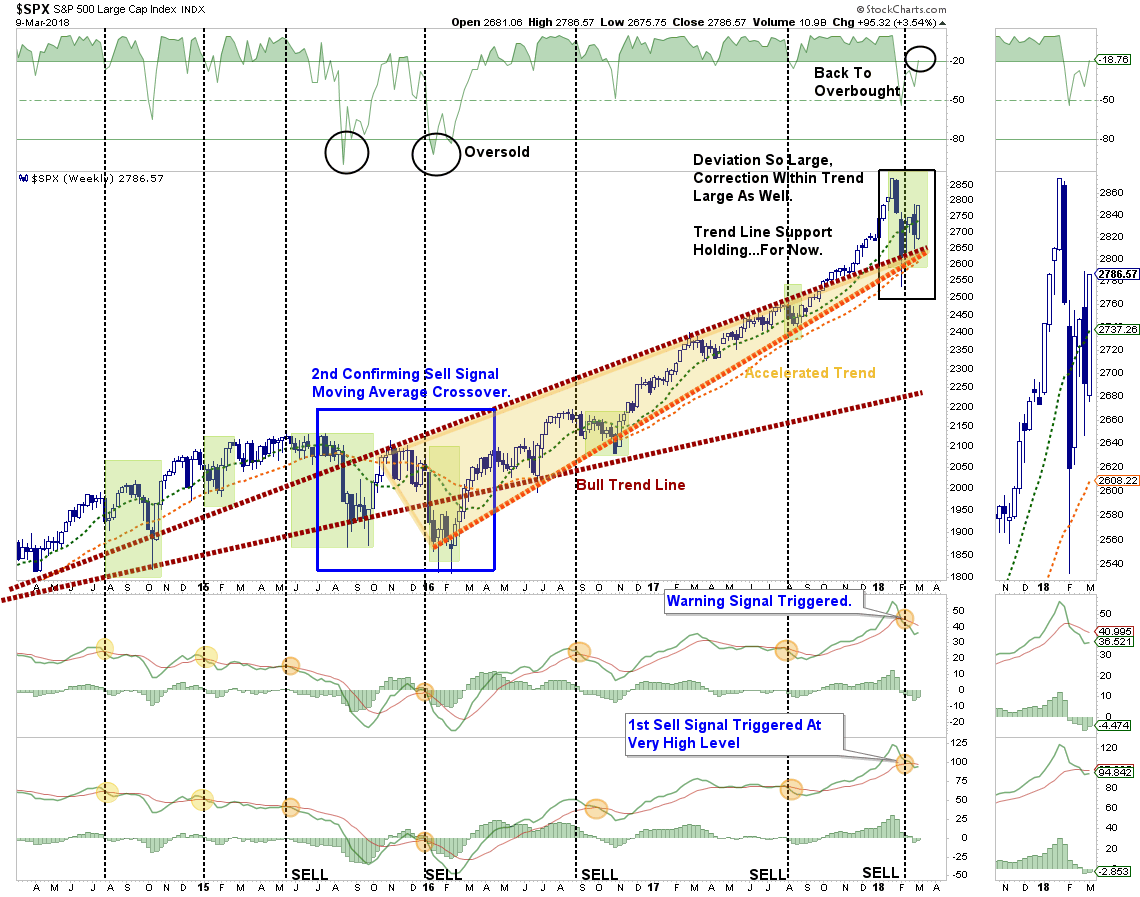
However, option (2) and (3) should not be dismissed either. On a longer-term basis, as I have noted previously, we still have fully registered sell signals. It will likely take a rally to old highs to reverse those “sell signals,” but with those signals at the highest level on record, there is likely a limit to a substantial upside advance.

While these “sell signals” do NOT mean a “bear market” is about to commence, when they have been previously triggered at “high levels,” they have been good indicators of a short to intermediate-term topping process.
The question we should ask is:
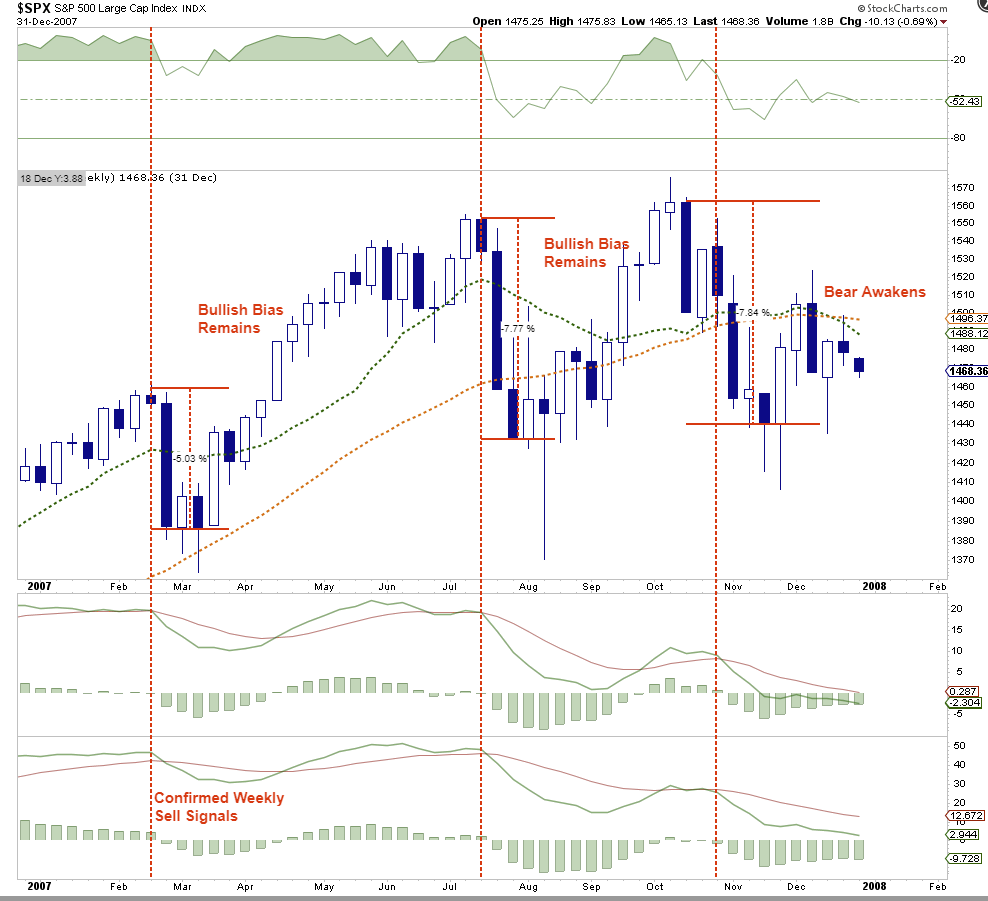
“Was the February correction the ‘Bear Stearns’ moment for the market?”
The chart below is what happened in 2007 after “Bear Stearns” collapsed in February of that year.

In 2007, the market was bullishly biased, we were in a “Goldilocks Economy,” and investors were giddy about future stock market prospects.


Leave A Comment