The calendar has now turned to the final month of 2017, and investors are beginning to get a clearer picture as to how the economy fared for the entire year. If there are no negative surprises over the next three to four weeks, it looks as if the U.S. economy experienced a visible case of “growin’ up” this year.
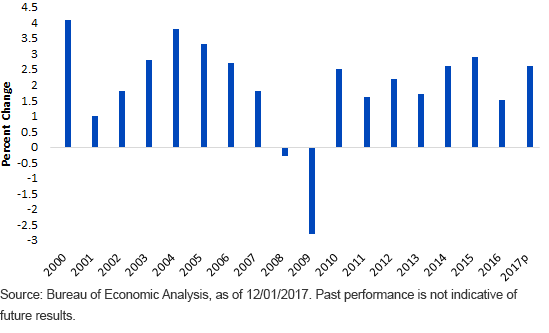
What exactly do I mean by that? As the table below clearly reveals, U.S. real GDP has experienced an uneven ride since the end of the great recession in mid-2009. Indeed, overall growth has come in at a +2.1% annual average over the time frame. Prior to this last economic downturn, the U.S. economy had grown at an annual rate of +2.7%, and this 2000–2007 period even included two negative quarters in 2001 and the beginning of the financial crisis in the second half of 2007. In other words, excluding those developments, one could make the case that growth was potentially closer to the +3% threshold, underscoring this recovery’s lackluster performance.
U.S. Real GDP

So how does the 2017 experience stack up? Based on the real GDP numbers through Q3 of this year that the Bureau of Economic Analysis has provided, the economy has grown at an average clip of +2.5%. For the final three months, consensus forecasts looked for a +2.7%1 gain, as of this writing. Interestingly, two widely followed GDP estimates come from the N.Y. Federal Reserve (Fed) (Nowcast) and Atlanta Fed (GDPNow), with their latest projections coming in at +3.9%2 and +3.5%3, respectively. I took the conservative approach and used the consensus estimate, which (if proven accurate) would wind up producing a 2017 real GDP of +2.6%. This would tie 2017 for the second-best showing since the end of the great recession, and close to the 2000–2007 average tally. If one were to split the difference between the aforementioned Fed projections, 2017 growth would be pegged at +2.8%, or close to the best reading post-recession.


Leave A Comment