If you are looking for some breathless post about the recent collapse of the junk and high-yield market over the past couple of weeks, then click somewhere else. I know it makes for exciting writing, but I won’t do it. There is already more than enough hyperbolic rhetoric filling the financial airwaves.


But the really amusing part? Have any of these doomdayers actually had a look at the return of these bond markets over the past year?
I hate to use ETFs to generalize an asset class’ returns, but the HYG and JNK ETFs seem to be on everyone’s lips as the epicenter of the recent terrible high yield “rout.” Heck, even newly crowned Bond King Jeffrey Gundlach watches JNK technicals for clues.

Let’s have a look at these awful “technicals” for HYG and JNK.


Yup. I can see why pundits are talking about the decline. It sure looks scary.
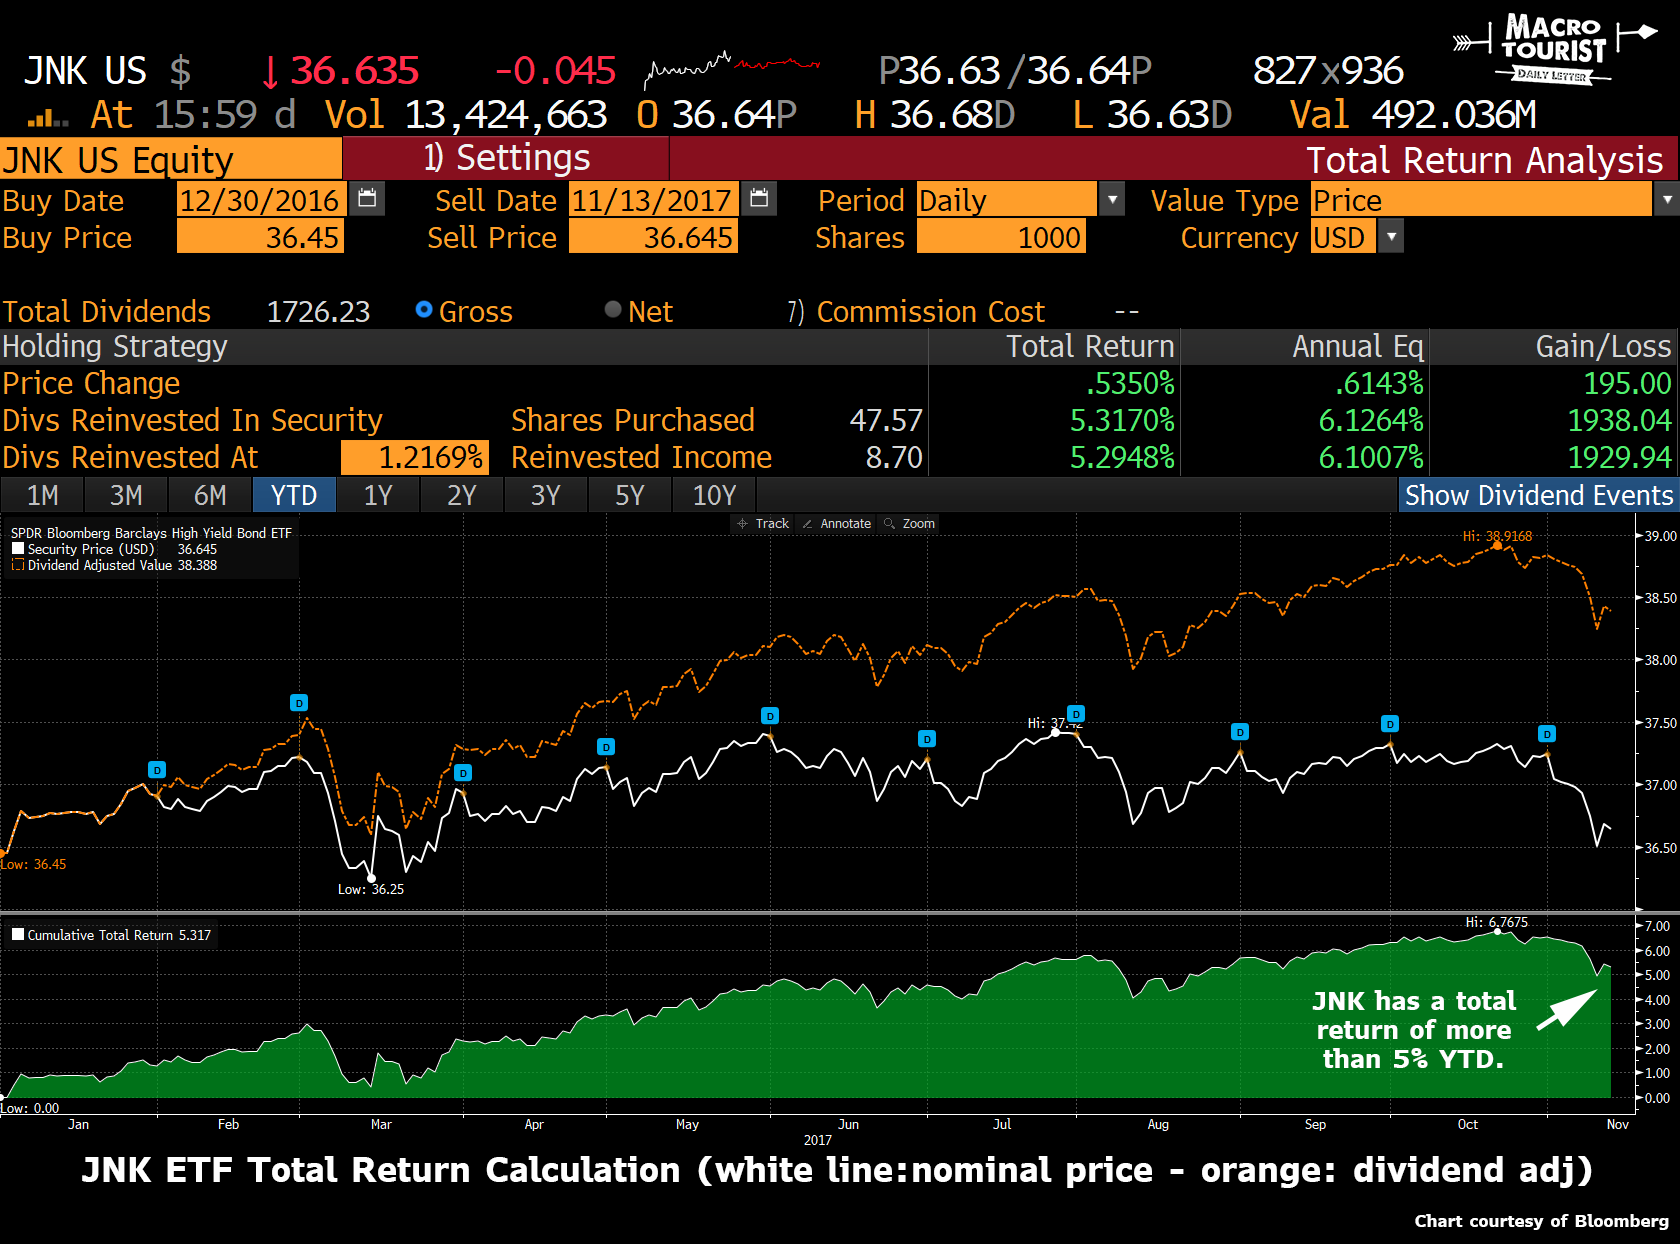
But is it? Both ETFs are bond funds – which means they pay interest as dividends. When examining the return of these assets, it is important to include these “interest payments” in the calculation.
What does it look like if we put these payments back into the equation?


Both the HYG and JNK are up approximately 5% year-to-date on a total return basis. So remind me again about the “rout?”
Spreads are even better behaved
Most bond traders talk about high yield and junk bond pricing as a spread against US treasuries. If a 5-year corporate bond is priced to yield 4.07% with the US t-note equivalent maturity trading at 2.07%, then the corporate is described as trading with a spread of 200 basis points.
This spread to treasuries represents the extra risk buying a private corporation versus the risk-free sovereign. If there was truly a high-yield rout, you would expect this spread to blow out.
Maybe I am wrong in my analysis of this high-yield “rout” being nothing to get excited about. Maybe spreads are blowing out, signaling increasing worry about private credit.


Leave A Comment