
A huge move is brewing in coffee, mark our words.
In this article, we take a look at the picture in coffee and sugar, separately.
First, coffee is close to a MAJOR breakout or breakdown point. This pattern is so clear, both on the short and long term charts. The daily, to begin with, has a narrow range between $1.15 and $1.25 which is the end stage of a chart pattern that is in the making for more than 12 months now.

The observation on the daily chart is not only confirmed, but also more outspoken on the weekly chart. The descending trendline (providing support) goes back to 2011, making it even more important. Expect a major move in coffee in the coming 2 to 3 months. Our bias is bullish, given the huge support level at $1.0.

Sugar, on the other hand, has a more ‘confusing’ chart pattern. Sugar broke out of a descending trend channel last October, only to find resistance at previous support (going back to February 2014). Right now, sugar is testing the trendline of its former trend channel. This is a make-or-break price point.

On the longer term chart, sugar has not proven to be strong enough to break through its 90 week moving average (WMA) which is our only technical indicator (our indicator for the long term trend). Note on the chart how sugar has always found resistance right at the 90 WMA, with the exception of October / November of 2015.

Conclusion:
We cannot read anything spectacular in the charts of sugar. On the contrary, sugar needs to time to choose a trend.
On the other hand, coffee is preparing a big move, which we anticipate around the April timeframe (or a bit sooner). The odds favor a bullish reaction. As coffee has proven to be very volatile, we do not exclude a major move of +50% in a matter of weeks. Agility will be key for investors and traders.

Related Posts
 Robots Will Change World Beyond Recognition Says BoA; Automation Will Change Jobs More Than Kill Them Says McKinsey
- AUD/USD Climbs Above The 0.7279 Zone, Looks For More Gain
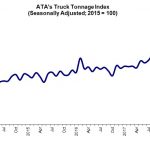 Trucking Data Improves In July 2017
- Urban Outfitters Beats Earnings Estimate
- Forex Forecast: Pairs In Focus July 3
 Consumer Confidence Remains At 17 Year High


Leave A Comment