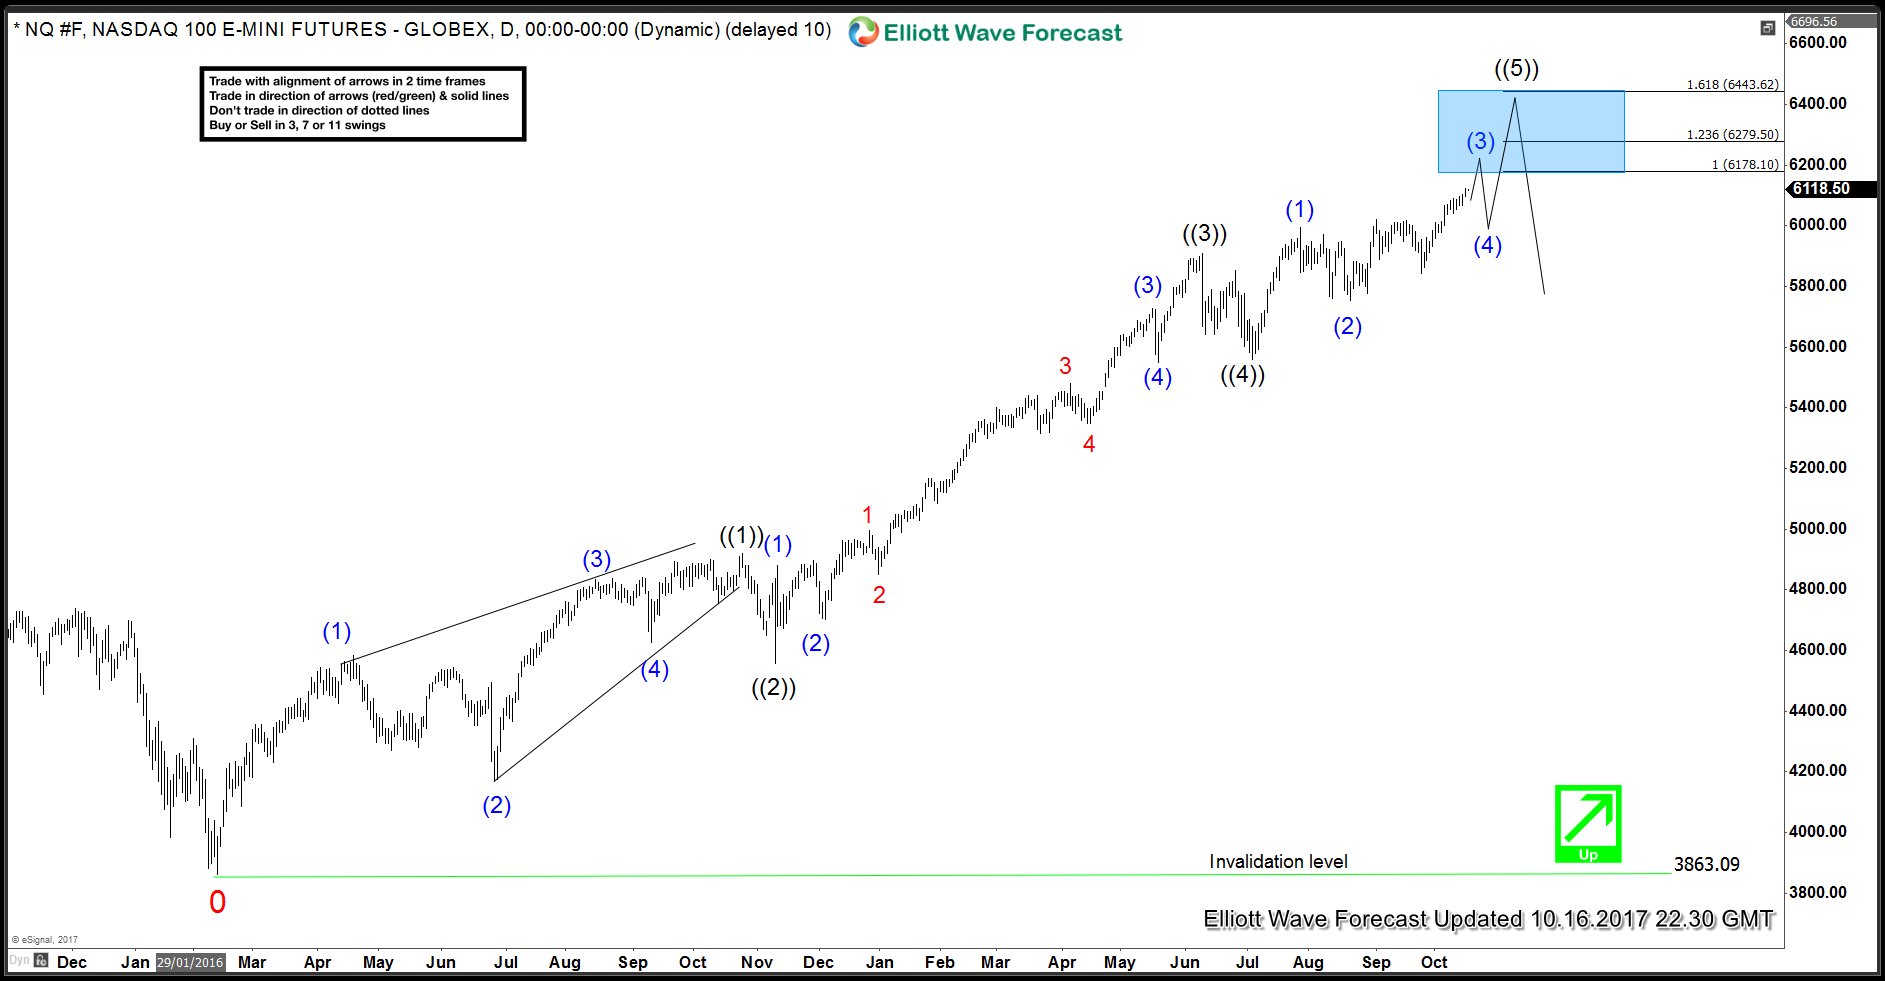
Nasdaq Futures rally from 2.11.2016 low is unfolding as an Elliott Wave Impulse as we can clearly see three channels in price and momentum (RSI) to support this idea. Wave ((1)) ended at 4919.50 as a diagonal, wave ((2)) ended at 4558.50, wave ((3)) completed at 5907.50 and dip to 5560 completed wave ((4)) on 7.5.2017. Up from there, so far we can only see three swings up and as wave ((5)) can’t be in 3 swings, we expect to see more upside in NASDAQ Futures to complete wave ((5)) which should also end the cycle from 2.11.2016 low. Near-term focus is on 6178 – 6279 area to complete wave (3) of ((5)) before we get a pull back in wave (4) to correct the cycle from 8.21.2017 (5752) low and higher again towards 6443 – 6604 area to complete wave ((5)).
Wave (3) of diagonal wave ((5)) is proposed to be unfolding as a double three WXY structure where wave W ended at 6019.75 and wave X ended at 5842. Index has already reached 100% extension of W-X at 6108 but has not yet reached 100% extension up from red X low so while dips stay above 10.10.2017 (6039), expect Nasdaq Futures to extend higher towards 6178 – 6279 area to complete wave (3). Break below 10.10.2017 (6039) low would suggest cycle from 5842 low ended and would favor the view that wave (3) also ended and Nasdaq Futures are already in wave (4) pull back to correct the cycle from 8.21.2017 low. Index has already reached 100% extension of W-X so we don’t like chasing strength here and don’t even like selling the Index. We see wave (4) dips when seen to offer the next ideal buying opportunity in 3, 7 or 11 swings.
Nasdaq Futures Daily Chart


Leave A Comment