Certainly, a main theme for fixed income investors in 2017 has been one of rising interest rates. There is no doubt that we have been down this road before, only to witness no increases, or in some instances even falling rates. So, what makes this time different, and should investors listen to, or ignore, “the boy who cried wolf”?
One of the key differences this time around is the Federal Reserve (Fed). The late 2016/early 2017 experience has highlighted this development, as policy makers raised the Fed Funds target range twice, for a total of 50 basis points (bps) in a three-month time frame. This latest rate hike by policy makers also came about three months earlier than market participants had initially anticipated, with the Fed projecting two more rate hikes this year and further moves for both 2018 and 2019. In addition, the Fed has also begun discussing the balance sheet normalization plan, specifically their reinvestment policy for Treasuries and agency mortgage-backed securities (MBS). If economic and financial conditions continue to match policy makers’ outlook, such action could commence later this year or early next year and, when combined with additional rate hikes, would most likely create a more challenging setting for the fixed income markets.
Obviously, the fiscal policy front got the ball rolling in the U.S. Treasury (UST) market following the election. The reassessment of what a Trump presidency and a Republican Congress could accomplish to jump-start the economy played an important role as well and continues to dangle over the rate outlook, notwithstanding the recent failure on the health care initiative.

For definitions on indexes in the chart, visit our glossary.
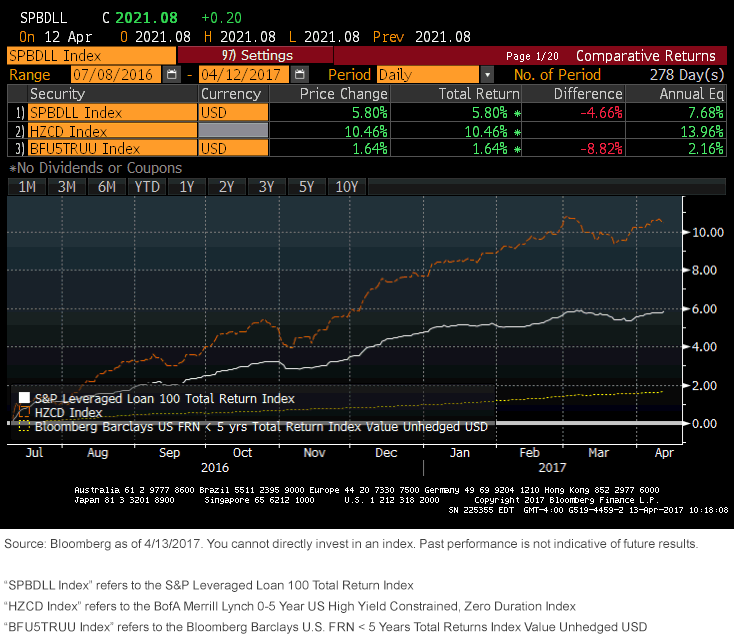
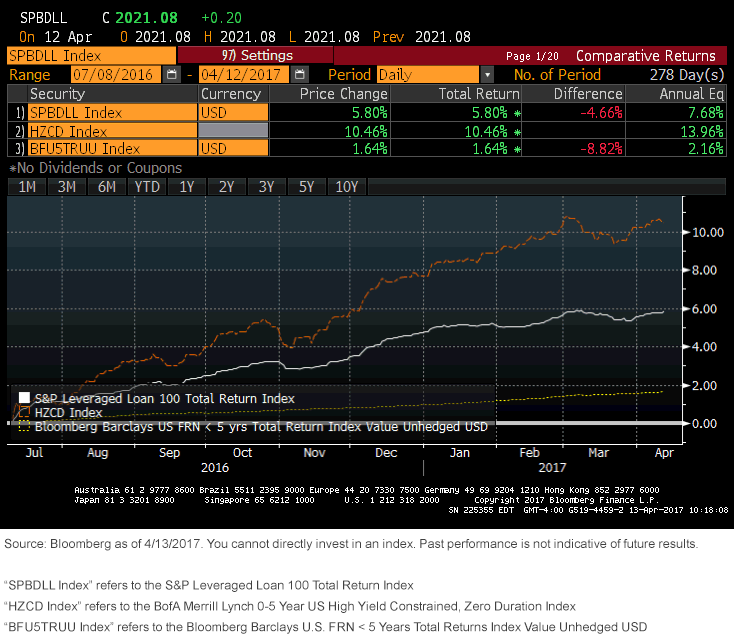
If fixed income investors are looking to insulate their portfolios from potential rate risk, two common strategies that have been used over time are: leveraged bank loans and/or floating rate products. The graph above illustrates how these two approaches fared over the last nine months, from when the UST 10-Year yield hit an all-time low on July 8, up to where rates stood as of this writing, or nearly 100 bps higher. By investing in the leveraged bank loan field, as represented by the S&P Leveraged Loan 100 Total Return Index, investors witnessed a positive return of +5.8%, whereas taking the floating rate approach (Bloomberg Barclays U.S. FRN < 5 Years Total Return Index Value Unhedged USD) also kept them in the plus column but at a measurably lower reading of +1.64%.


Leave A Comment