We have shown lately than many of our indicators and quite some markets have arrived at critical levels: stocks and gold are at crossroads, bonds and treasuries are at inflection points, and the bonds to stocks ratio is suggesting that both markets are looking for a (new) trend.
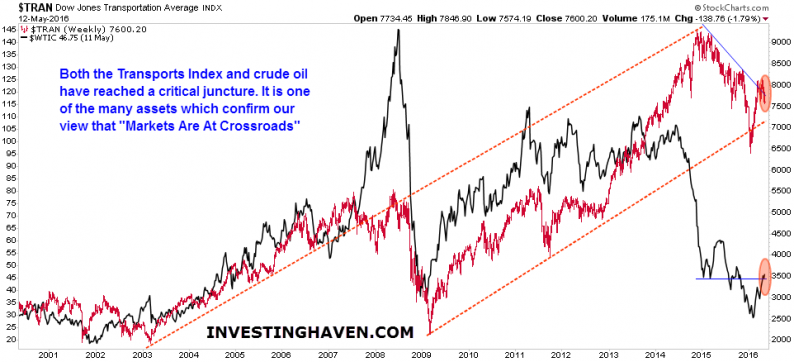
Here is another indicator which underlines the same observation: the Dow Jones Transportation Index and crude oil. Both assets have a strategic importance, both because of their economic value and barometer.
Below chart shows that the transportation index (red chart line) is moving within a multi-year trading range, but support is being tested right now. Simultaneously, crude oil is testing resistance.
Both assets tend to move in tandem, but there is a strong divergence in extreme times (2015 and 2008 are great examples).
This chart learns that investors have to be patient, and that a new trend is in the making. Which direction is hard to say, although we favor a scenario in which stocks will outperform commodities, gold will sell off big time, and the dollar will stabilize (read: not break down). However, we are open to every outcome, and prefer to let the markets speak and set direction.


Leave A Comment