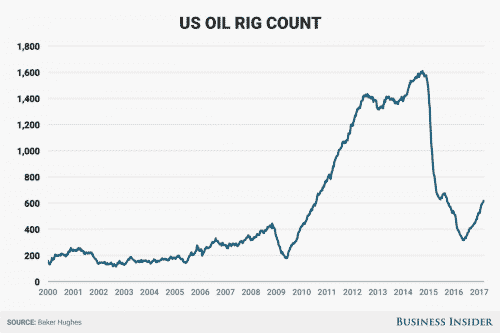
Here’s a chart that Business Insider put together after Friday’s rig count showed yet another build that took us to September 2015 levels.

Source: Business Insider
The only time I remember seeing a parabolic move like this followed by a dramatic bust was during market manias.
Question: Was the shale oil capital expenditure explosion simply a bubble? What trendline does this chart follow going forward and what does it mean for price? These are some fundamental questions that need to be answered.
The skeptic in me says that we have just witnessed a mania that will not repeat. That means that even the uptick in rig count we have seen since the shale oil bust is simply an echo bubble that’s unsustainable. At the same time, I recognize that there are enough players in the shale market that an oil price in the $50-55 region will incite a lot of production supply investment.
My view: the oil CapEx bust is not over. It will proceed in stages – price yo-yo-ing wildly until we can get a smooth production curve. That means we will see more shale oil busts in the future until enough excess supply can be excised from the market to prevent a mass entry of producers at modestly attractive price points.


Leave A Comment