from the St Louis Fed
— this post authored by Ana Maria Santacreu and Heting Zhu
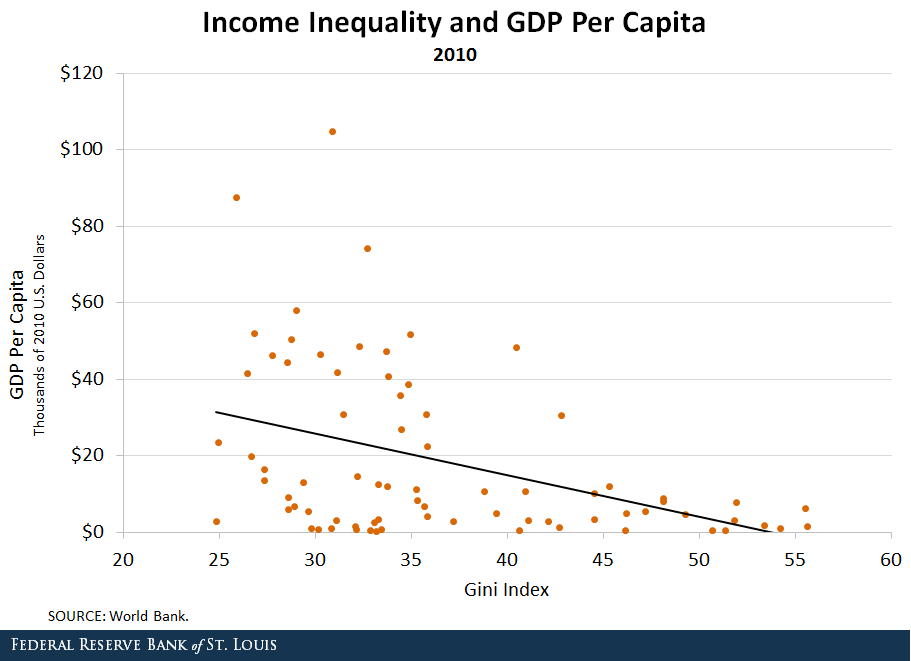
Rich countries tend to have lower income inequality than developing countries. The figure below shows a negative relationship between the level of income per capita (which is a measure of technological progress) and the Gini coefficient of income (which is a measure of inequality within a country).[ 1]


Income Inequality by Region
When we dig deeper into the data, we observe that the countries with the highest income inequality are countries in Latin America and Africa. Advanced economies, on the other hand, display lower income inequality.
To examine these patterns further, we placed the countries shown in the figure into six regional groups and computed the average Gini coefficient for each group. The results are in the table below.
Latin America and Africa have the highest inequality with a Gini of 48.82 and 44.26, respectively, whereas Europe and more advanced economies have lower income inequality. Consistent with the results of the figure, the table shows a negative correlation between the level of income per capita and the Gini coefficient to some extent.
Income Inequality by Country
When we analyze countries within each group separately, interesting patterns emerge. For instance, income inequality in the U.S. is large, despite the U.S. having one of the highest levels of income per capita in our sample. Specifically, the Gini coefficient of the U.S. was 40.46 in 2010, very close to the average Gini coefficient of African countries in our sample.


Leave A Comment