
Unevenly Distributed Dollar Strength Has JPY Weakness In Question
USD/JPY has moved cleanly lower from the 110.50, which aligns with a multitude of resistance that we’ll unpack later. Over the weekend events, which included the G-7 meeting and Japan’s Trade Surplus that swelled unexpectedly to the largest amount since 2010 when the JPY was in an environment of persistence strength. The economic surprise brought short-term JPY strength, but that may not be long lasting.
Many had discounted the probability of BoJ intervention ahead of the G-7 Summit last weekend that Japan hosted. However, now that the G-7 meeting is in the rearview mirror, many traders think that all bets are off, and we could see renewed vigor from the BoJ to not let JPY buyers enjoy their JPY strength for as long as they have. The other possible scenario is renewed US Dollar strength on the back of renewed belief that the Fed will hike rates, and set the Dollar off on a path of policy divergence of other currencies.
The problem with the above scenarios is that they’re potential scenarios at best. Policy makers in the United States & Japan have mentioned their intentions. However, so far they have been long on words and short on actions of late. In times like this, it’s helpful to look at the charts.
USD/JPY Has Run Into Strong Ichimoku Cloud Resistance
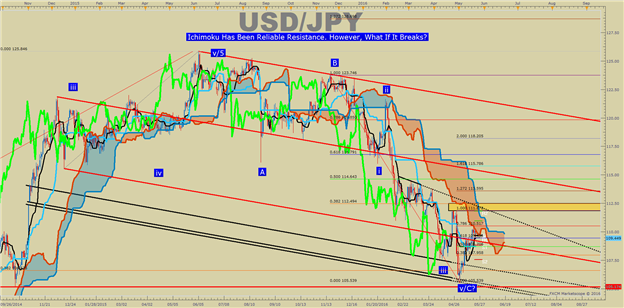
On the chart above, you’ll notice we’ve found long-term bearish resistance. The different technical tools and indicators that met price at near 110.50 were (listed in order of Importance) the Daily Ichimoku Cloud, the 55-DMA, and the 78.6% Fibonacci Retracement of the late-April to May Range.
If the fundamental story plays out even half-as-well as it could, with either the BoJ easing or Fed hiking beyond what is currently priced, I like the former scenario more of the two; we could see a move through resistance mentioned below that could make USD/JPY longs jump for joy this summer.

Related Posts
 EC
Q1 Earnings Season To Show Growth Acceleration
EC
Q1 Earnings Season To Show Growth Acceleration ?EUR/USD Bearish Momentum Could Break Bullish Channel Source
 5 Undervalued Dow Stocks To Research – November 2015
 Is This The Long-Awaited Silver Short Squeeze, The Beginning Of The Next Bull Market, Or Both? Or, Sigh, Neither?
 USD/JPY Forecast Aug. 13-17 – Safe Haven Flows Beat The Strong Dollar
- Indian Indices Trade Flat; Auto Stocks Witness Buying


Leave A Comment