This post is an excerpt from the weekly review of the Fed’s liabilities and other banking system data that is crucial to understanding the context of financial market behavior, in the Wall Street Examiner Pro Trader Macroliquidity Reports.
Macroliquidity Pro Trader weekly subscribers (or Professional Edition), click here to download complete report in pdf format.
Where else can we review the weekly balance sheet changes of a major corporation, bank, or other financial institution weekly? The Fed provides the means for us to look at its balance sheet every week and actually follow the flows of funds as they move from the Fed to the Federal Government to the banks and vice versa. That was particularly useful during QE because we could see each week exactly how the Fed printed money and it would enter both the banking system, the financial markets, and the economic stream. Without QE, it’s not as sexy a pursuit today, but it’s still one that is worthwhile because it enhances our understanding of just how all the levers and pulleys work.
If you have a background in accounting or at least a couple of college level courses you should be able to recognize the usefulness of this data instantly. If you lack that background, don’t worry, I track, analyze and explain it for you week in and week out so that in a few weeks time, you too will clearly understand just how the funds enter and influence the markets and the economy.
Here’s what it looks like this week.

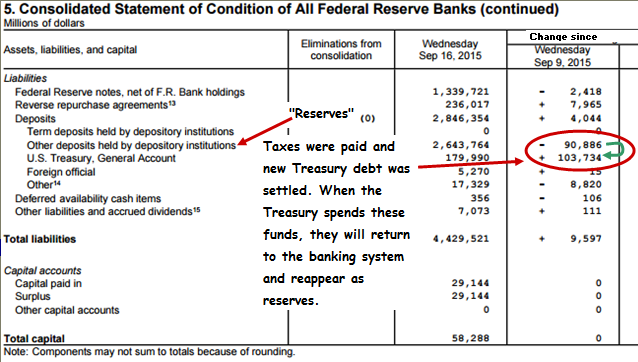
Fed Liabilities Week Ended September 16
Click to view if reading in email
The US Treasury had net deposits of a massive $104 billion to its checking account at the Fed last week as it took in quarterly estimated taxes from individuals and corporations and had a mid month bond and note sales settlement. It continues to carry a record cash balance (see Federal Revenues Report) for this time of year but the margin is rapidly dwindling as the Fed cuts back on bill offerings to avoid running over the debt ceiling.


Leave A Comment