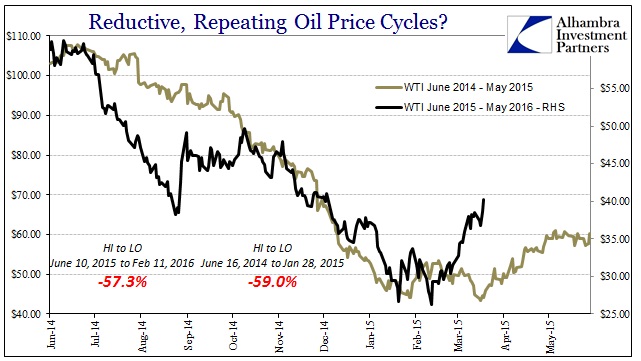
From June 2014 until late January 2015, oil prices (WTI) fell about 60%. From June 2015 until late January 2016, oil prices (WTI) fell about 60%. The exact track each annual trading history took to achieve those results is different (2014-15 much more straight ahead and persistent; 2015-16 jagged and irregular), but you can’t deny the repetition in both the amount of time and the ultimate scale of the collapse. To my personal view, such self-similarity (fractal) is funding and “dollar.” The rebound after the latest “dollar” run is so far more quick and intense, but it remains to be seen whether that will make any difference.


Leave A Comment