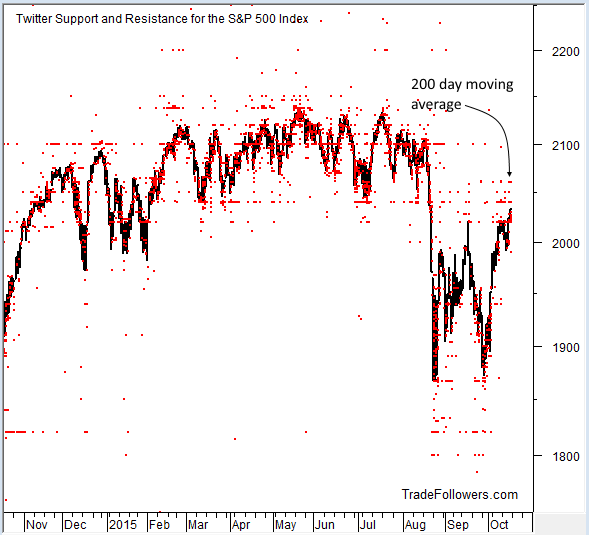
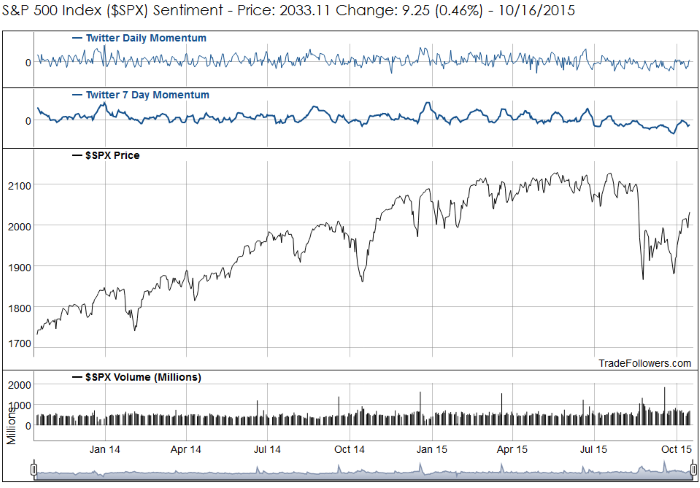
Last week the market broke through the September high which was the first level of minor resistance on the Twitter stream. Now there are two major resistance levels in the way for the S&P 500 Index (SPX). 2040 was the breaking point of a sideways range during the first of the year. It is now getting the most tweets which makes it major resistance. Just above that is 2060 where the 200 day moving average comes into play. At the least we should expect some consolidation in the 2040 to 2060 area. This would be healthy for the market to shake out some weak holders.

If we get the consolidation I’ll be watching the action of 7 day momentum closely. What I’d like to see is a higher low than the late September low. This would give us a new confirming uptrend line and increase the odds that market participants are comfortable with pushing the market higher. If 7 day momentum prints a lower low it will be a very bad sign that we may have entered a long term bear market. This puts SPX in a critical position. You can follow the SPX chart yourself here.

Breadth calculated between the most bullish and bearish stocks on Twitter fell farther this week. Once again, it is a result of the number of bearish stocks rising while the bullish stocks remained relatively flat. It appears that the value buying has paused and leadership buying hasn’t started en masse yet. What we want to see is an increase in the number of bullish stocks…and preferably those stocks should be in leading sectors. You can see daily updates to the breadth chart here. Also watch the daily and weekly bullish lists to verify that leading stocks are where sentiment is flowing. This link has multiple time frames (just click the “1 Week”, “2 Week”, etc. headers to sort the list by that frequency). This view makes it easy to spot stocks in long term up trends that have consolidated and are now moving higher again. Look at the “Long Term Ideas” section of this page to see how to spot consolidation periods for strong stocks and then buy the dip.


Leave A Comment