Bitcoin’s (BTC) dip below $29,000 on June 22 rocked the markets a handful of analysts to call for a potential drop below $20,000.
Many traders on crypto Twitter were focused on the formation of a death cross on the Bitcoin chart as an omen for another potential drop in the price but analysts with a more contrarian point of view look at this chart pattern as a signal that it is time to buy the dip.
The ultimate thread on #BTC deathcross and cycle data analysis
1) Historical #deathcross until #goldencross time (in days) + largest price swing since deathcross begins:
2011: 180 D, -59%
2014: 90 D, +83%
2014: 390 D, -63%
2018: 360 D, -55%
2019: 105 D, -29%
2020: 50 D, +66% pic.twitter.com/8JmbtnFLGJ
— venturefound?r (@venturefounder) June 17, 2021
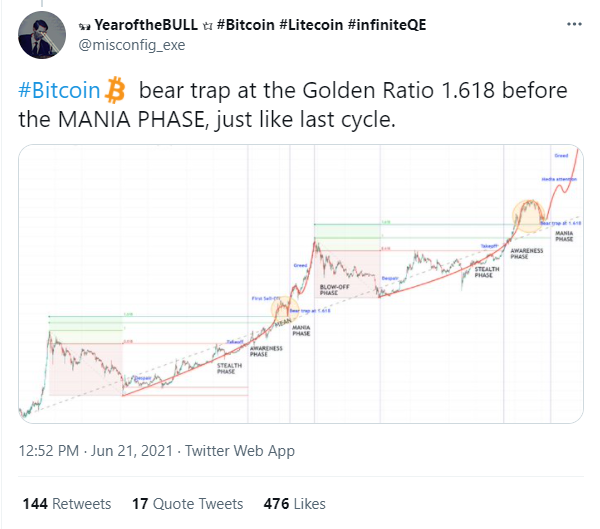
Three reasons why some traders still see a bull case for Bitcoin include the appearance of the “spring” stage of the Wyckoff accumulation model, steady buying by long-term holders and the formation of a bear trap at the golden ratio that is similar to moves seen during previous bull runs.
The Wyckoff model says spring has arrived
The Wyckoff accumulation model has been all the rage amongst cryptocurrency analysts over the past month as the price action for Bitcoin has been tracking the pattern relatively closely since the May 19 sell-off.
Wyckoff Accumulation Model – Spring Test
Seems like a possibility. We just got the lower low at $28.8K … If this model plays out we will now enter the final phase of the recovery back up. Lets see how it play out. #Bitcoin pic.twitter.com/stuWJRWWoL
— Kevin Svenson (@KevinSvenson_) June 22, 2021
As seen in the tweet above, Bitcoin’s plunge below $29,000 and the subsequent recovery above $32,000 has some analysts suggesting that the “spring test” seen in phase C of the Wyckoff pattern has been fulfilled. This would indicate that the bottom is in for the current correction and now begins the choppy climb higher.
If this turns out to be true, BTC would enter phase D, also known as the “markup phase” where a new uptrend is established and “pullbacks to new support offer buying opportunities” that are often seen as opportunities to buy the dip.
Related: Bitcoin drops below $36K as century-old financial model predicts big BTC crash
In phase D a breakout to new highs is expected as the cycle completes and prepares to potentially begin again once the move higher is exhausted.
Long term holders are still bullish
Another bullish sign cited by analysts is the steady accumulation by long-term holders.
If you’re scared, just remember what the #Bitcoin long term holders are doing right now. Don’t let the vola flush you out, think long term.https://t.co/koCh7pfGf9 pic.twitter.com/bAba8DUWo2
— Yann & Jan (@Negentropic_) June 22, 2021
The Bitcoin long-term net holder position shows that investors actually began to reaccumulate back in late April and they began to significantly increase their activity in May as the price fell into the $30,000 to $40,000. On-chain data shows that these investors have continued to buy into the most recent dip.
This activity suggests that more experienced crypto traders are familiar with Bitcoin’s market cycles and view the current range as a good level to open long positions when fear is high and the sentiment is low.
The biggest rewards go to those who take the risk to buy an asset amid plunging prices and sentiment, and these are the types of situations where the contrarian traders thriv.
A bear trap lurks at the golden ratio
The third scenario some analysts are focusing on suggests that the current price movements have set up a bear trap that echoes a move seen during the last cycle which involves a pullback to the 1.618 golden ratio extension level which will then be followed by a breakout to new highs.
 From this perspective, the market is currently in the awareness phase of the four psychological stages of asset bubbles. After the bear trap occurs, Bitcoin will enter the mania phase where widespread media coverage attracts the attention of new market participants who then chase the price to ever-increasing heights “based on the delusion that the asset will keep going up, forever.”
Previous calls for the possibility of Bitcoin reaching a price of $200,000 by the third or fourth quarter of 2021 by veteran trader Peter Brandt, who was far from alone in predicting its value to surpass the $100,000 mark this year, would suggest that the long-expected blow-off top is yet to come.
The views and opinions expressed here are solely those of the author and do not necessarily reflect the views of Cointelegraph.com. Every investment and trading move involves risk, you should conduct your own research when making a decision.


Leave A Comment