An important part of preserving investing profits is knowing when an asset or sector is showing signs of exhaustion and when a sector rotation is underway.
This is especially important in the rapidly moving cryptocurrency markets, which can change direction in a heartbeat and turn crypto millionaires into depressed bag holders.
Most investors know that the nonfungible token (NFT) sector has been on fire since July, and as CryptoPunks, Mutant Ape Yacht Club and pet EtherRock NFTs fetched six- and seven-figure sums, while top NFT marketplace OpenSea surpassed $4 billion in total sales. While the frenzy has been exciting, many new projects have launched across a variety of blockchain networks, and the recent decline in transaction volumes could be a signal that investors are looking to move to different pastures.
In the first quarter of 2021, decentralized finance (DeFi) protocols and their related tokens were the focal points for investors, but this sector cooled off in March as the NFT market underwent its first bull market. Now it appears that the tide has begun to change, and the profits made from NFT trading could be making their way back into altcoins and DeFi markets.
Here are five signs that a capital rotation might be underway from NFTs into the DeFi sector.
Large- and small-cap DeFi tokens rally
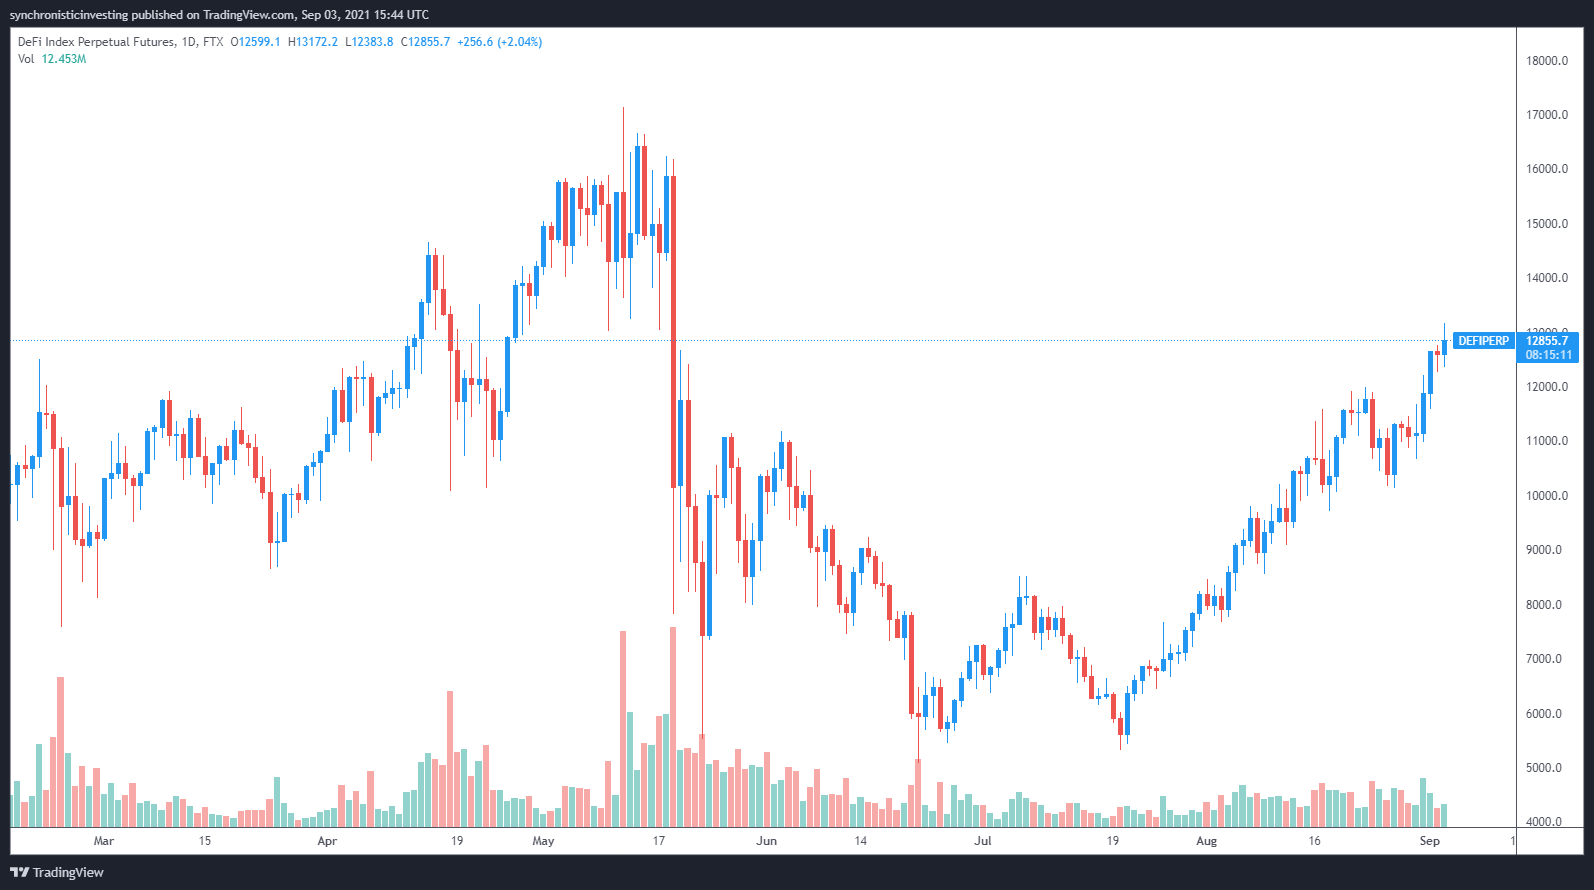
DeFi Perp is an index token on the FTX cryptocurrency exchange that comprises a basket of 25 of the top DeFi-related cryptocurrencies, including Maker (MKR), Polkadot’s DOT, Solana (SOL), Curve DAO Token (CRV), Uniswap (UNI) and SushiSwap (SUSHI).
Data from TradingView shows that the price of DeFi Perp has been on the rise since bottoming out at $5,331 on July 20, and it has since rallied 138% to a daily high at $12,771 on Sept. 2.

NFT prices are cooling off
Since rapidly rising NFT prices have been the main feature catching the public’s attention, it is also a red flag and a good metric for judging the overall health of the sector. As shown in the chart below, which tracks the daily average price floor of NFTs sold in the market, the average price floor reached a high of 1.02 Ether (ETH) on Aug. 29 and has since pulled back to 0.5 ETH.

Active users and transactions on DeFi platforms surge
Another sign that the DeFi ecosystem continues to grow is the steadily increasing number of DeFi users over time, as shown below in data from Dune Analytics.

While this metric tracks the number of unique wallet addresses that interact with DeFi protocols and it’s possible that some users have multiple addresses, the situation has become more complicated in recent times. The longer-term nature of earning a yield in DeFi via staking, providing liquidity or locking tokens on protocols has arguably led to a decline in users switching between multiple wallets and paying high gas fees to constantly move assets.
The continued entrance of new users into the DeFi space could signal that some who have made profits in NFTs are now looking to lock in profits and earn a yield, while newcomers to the market are attracted to its lower-risk opportunities.
$4,000 ETH signals a rotation in play
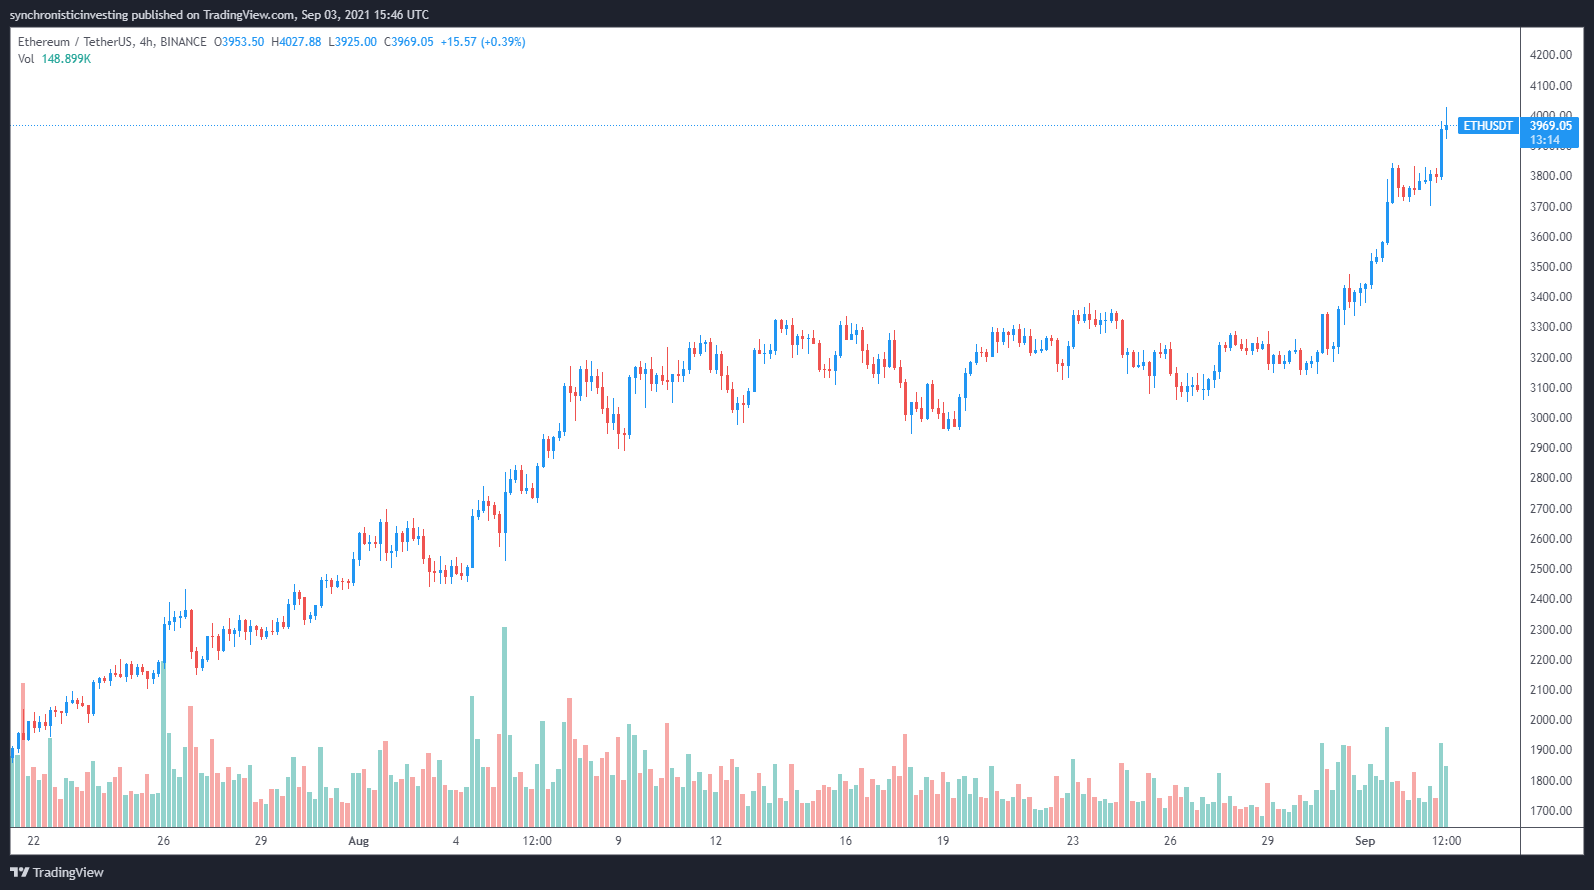
Another development that could signal a sector rotation toward DeFi is the rising price of Ether.

With most of the top DeFi protocols located on Ethereum, the top altcoin is one of the main assets in the DeFi ecosystem and is widely used to stake and purchase other tokens.
Related: Is Ethereum’s rally signaling the next bull market phase for Bitcoin above $50K?
DeFi TVL hits a new all-time high
A final metric that indicates that a sector rotation into DeFi is underway is the total value locked (TVL) on all DeFi protocols. On Sept. 2, the figure reached a new record high of $171.5 billion.

While the NFT boom might not be over, multiple data points suggest that the bullish momentum has reached an exhaustion point, and the current run-up in altcoin and DeFi prices is a signal that a rotation is in its early stages.
Want more information about trading and investing in crypto markets?
The views and opinions expressed here are solely those of the author and do not necessarily reflect the views of Cointelegraph.com. Every investment and trading move involves risk, you should conduct your own research when making a decision.


Leave A Comment