Bloomberg Intelligence senior commodity strategist Mike McGlone equated the current consolidation in Bitcoin (BTC) price to that of a “caged bull, well-rested to escape.” When compared with the rallies a year after the previous two Bitcoin halvings in 2012 and 2016, the strategist called the current price action “tame.’
According to McGlone, Bitcoin is “still in price-discovery mode” and its plateau is still far away.
While Bitcoin remains in focus, altcoins have continued to steal the show. Bitcoin’s market dominance, which stood closer to 70% on Jan. 4 has continued to slide even though its price has risen more than 104% year-to-date. The current market dominance at 54.3% is the lowest since April 2019 according to data from CoinMarketCap. This suggests that several altcoins are outperforming Bitcoin by a large margin.
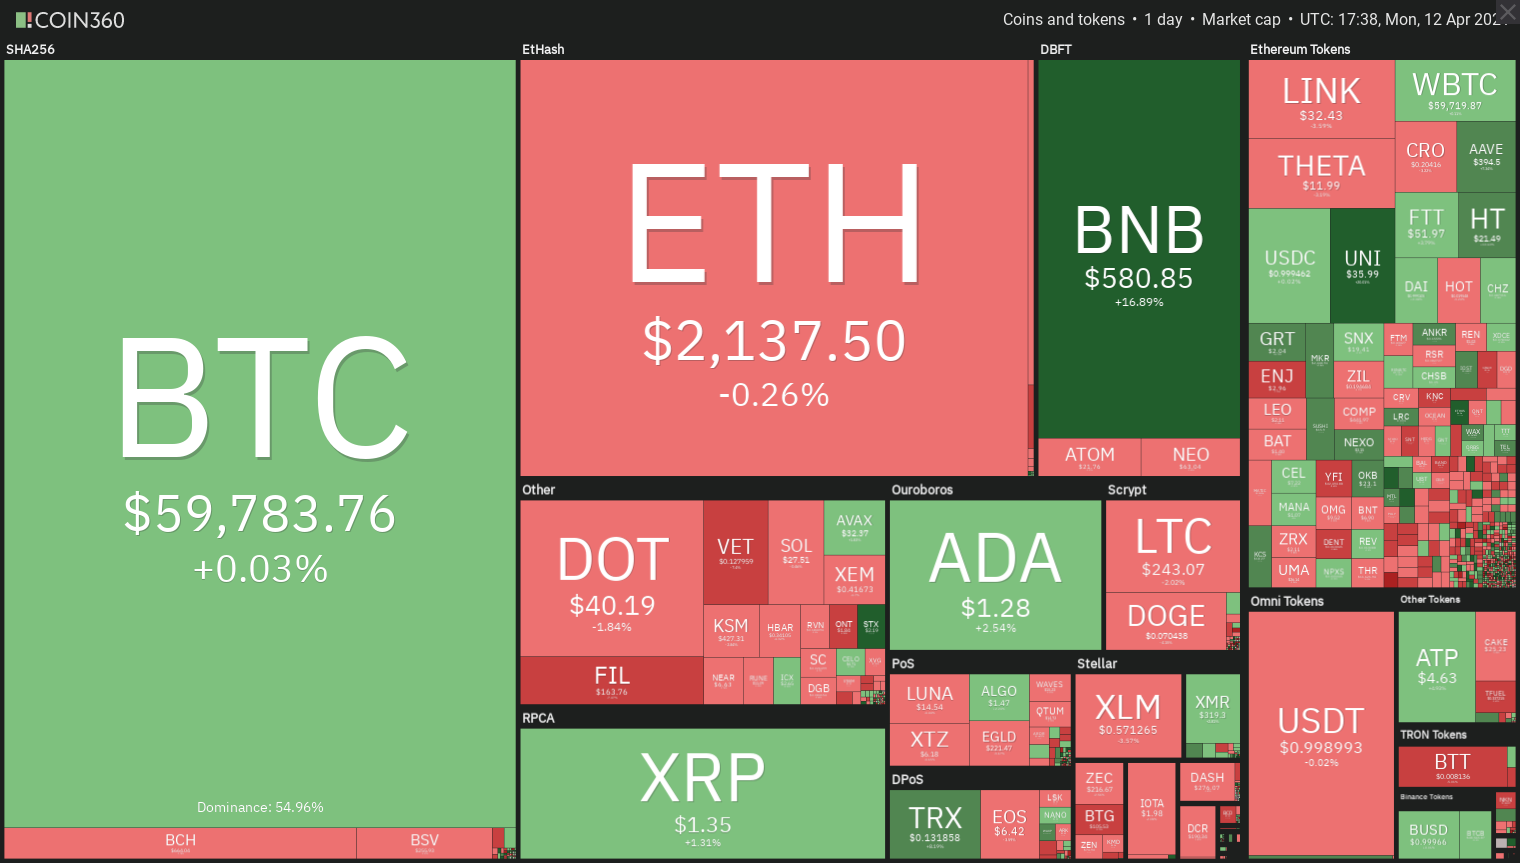
Will Bitcoin continue to trade sideways while altcoins rally or will it resume its uptrend and lead from the front. Let’s analyze the charts of the top-10 cryptocurrencies to find out.
BTC/USDT
Bitcoin formed an inside day candlestick pattern on April 11, indicating indecision among the bulls and the bears. The bulls tried to resolve this uncertainty to the upside today by piercing the all-time high at $61,825.84, but the bears had other plans. They again successfully defended the overhead resistance.

If the bulls can drive and sustain the price above $61,825.84, the BTC/USDT pair will complete a bullish inverse head and shoulders pattern. That could result in a rally to the pattern target at $69,540. If the momentum sustains, the next target to watch out for is $79,566.
This bullish view will invalidate if the pair turns down and breaks below the 50-day simple moving average ($54,7823). Such a move could signal the start of a deeper correction.
ETH/USDT
Ether (ETH) has been trading above the breakout level at $2,040.77 for the past three days, but the up-move lacks momentum. The long wick on the April 10 candlestick and the inside day candlestick pattern on April 11 suggests hesitation by the bulls to push the price higher.
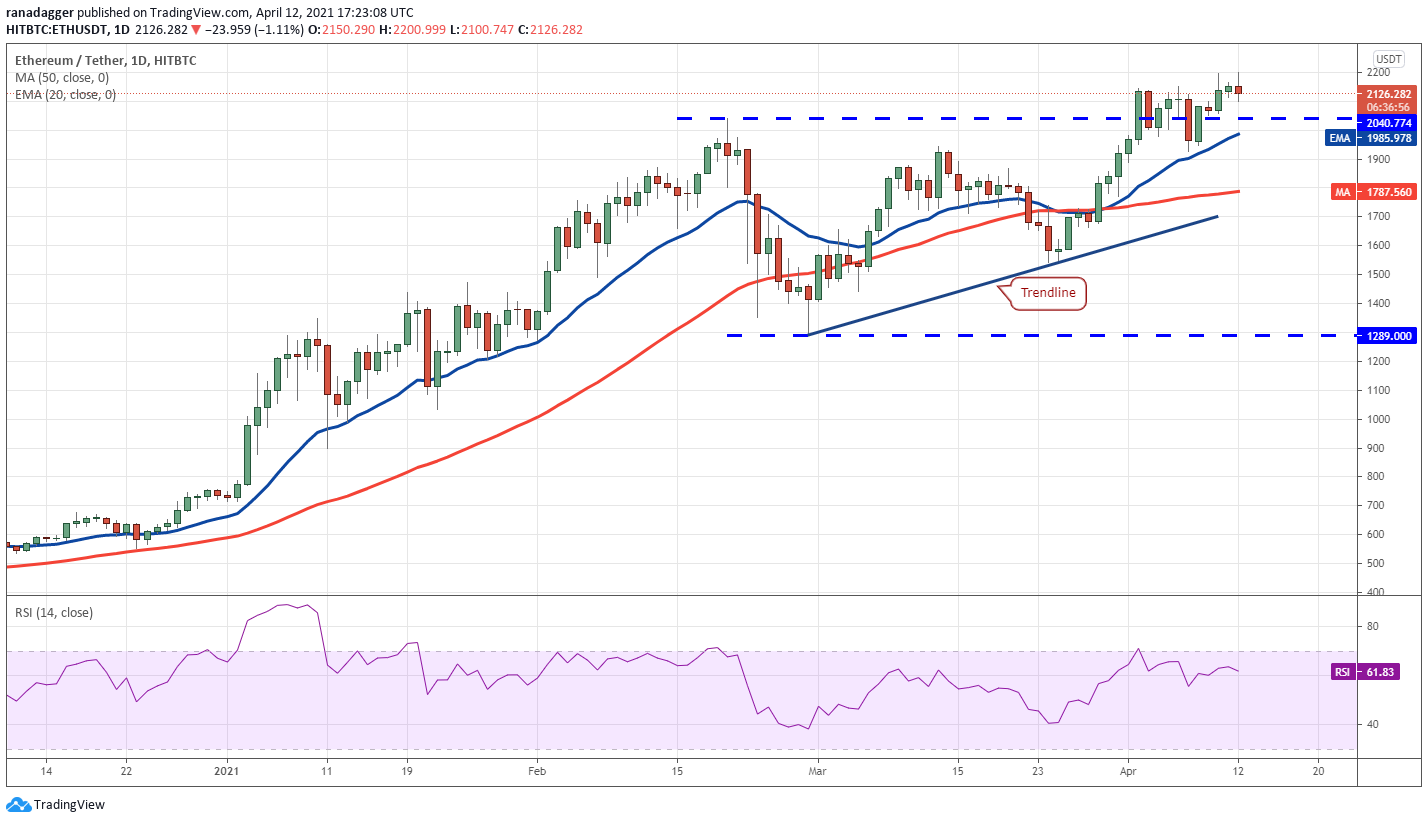
However, the upsloping 20-day EMA and the relative strength index (RSI) above 61 indicate advantage to the bulls. If the bulls punch the price above $2,200 with force, the pair may start the next leg of the uptrend that could reach $2,618.14.
BNB/USDT
Binance Coin (BNB) is in a strong uptrend, but the up-move of the past two days is showing signs of a melt-up. The long wick on today’s candlestick suggests some traders are booking profits at higher levels.

The first support on the downside is the 38.2% Fibonacci retracement level at $483.95. If the price rebounds off this support, it will suggest the sentiment remains positive and bulls are buying on dips. They will then try to resume the uptrend by pushing the price above the all-time high at $638.56.
If they succeed, the next leg of the uptrend could begin, which may propel the BNB/USDT pair to $888.70. On the contrary, if bears sink the price below $483.95, the pair could drop to the 20-day EMA.
XRP/USDT
The volatility contraction on April 9 was resolved to the upside on April 10 and XRP rallied above $1.11. The bulls continued their purchase on April 11 and pushed the price to $1.50. However, the long wick on the day’s candlestick suggests traders booked profits at higher levels.
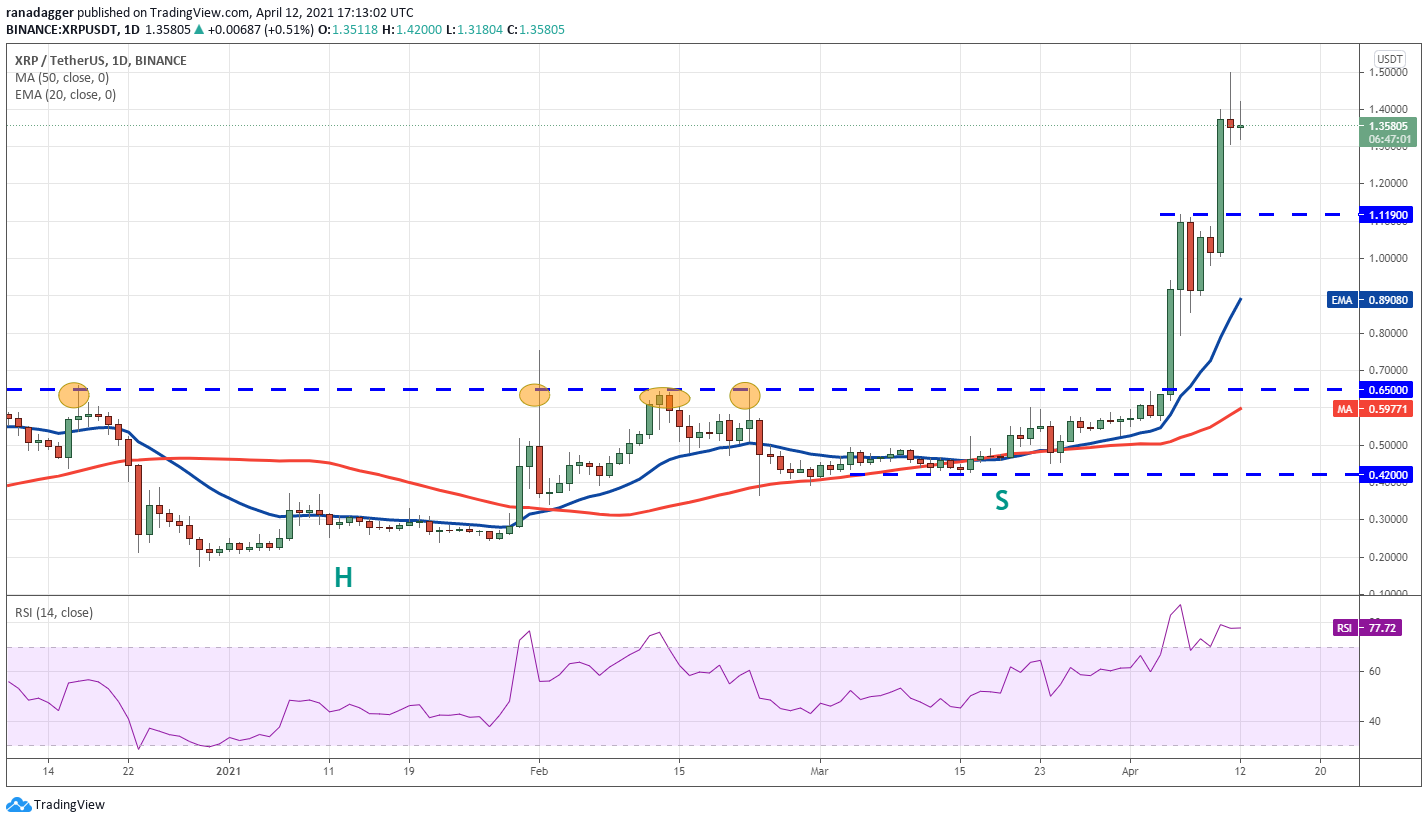
If the buyers can propel the price above $1.50, the XRP/USDT pair could rally to $2. Contrary to this assumption, if the price turns down and dips below $1.30, the pair could start a correction.
The major support on the downside is $1.11. If the buyers can flip this level into support, the pair will make one more attempt to rise above $1.50. On the other hand, a break below $1.11 may result in a drop to the 20-day EMA ($0.89).
ADA/USDT
The bulls successfully held Cardano (ADA) above the 50-day SMA ($1.17) in the past few days and are currently attempting to start an up-move. However, the long wick on today’s candlestick suggests that buying dries up above $1.33.

A rebound off this zone could keep the pair range-bound for a few more days. Alternatively, if the bears sink the price below the zone, the pair could decline to $0.80.
This negative view will invalidate if the pair sustains the price above $1.33. That could push the price to $1.48. A break above this resistance could start the next leg of the uptrend that may reach $2.
DOT/USDT
Polkadot (DOT) has been sandwiched between the 20-day EMA ($39.30) and the overhead resistance at $42.28 for the past few days. However, this tight range trading is unlikely to continue for long.

The marginally upsloping 20-day EMA and the RSI above 54 suggest only a minor advantage to the bulls. If the bears can sink the price below the moving averages, it will open the gates for a decline to $32.50 and then $26.50.
UNI/USDT
Uniswap (UNI) has soared above the all-time high at $36.80 today. Although the moving averages are yet to turn up, the RSI has risen close to the overbought territory, indicating a pick-up in momentum.
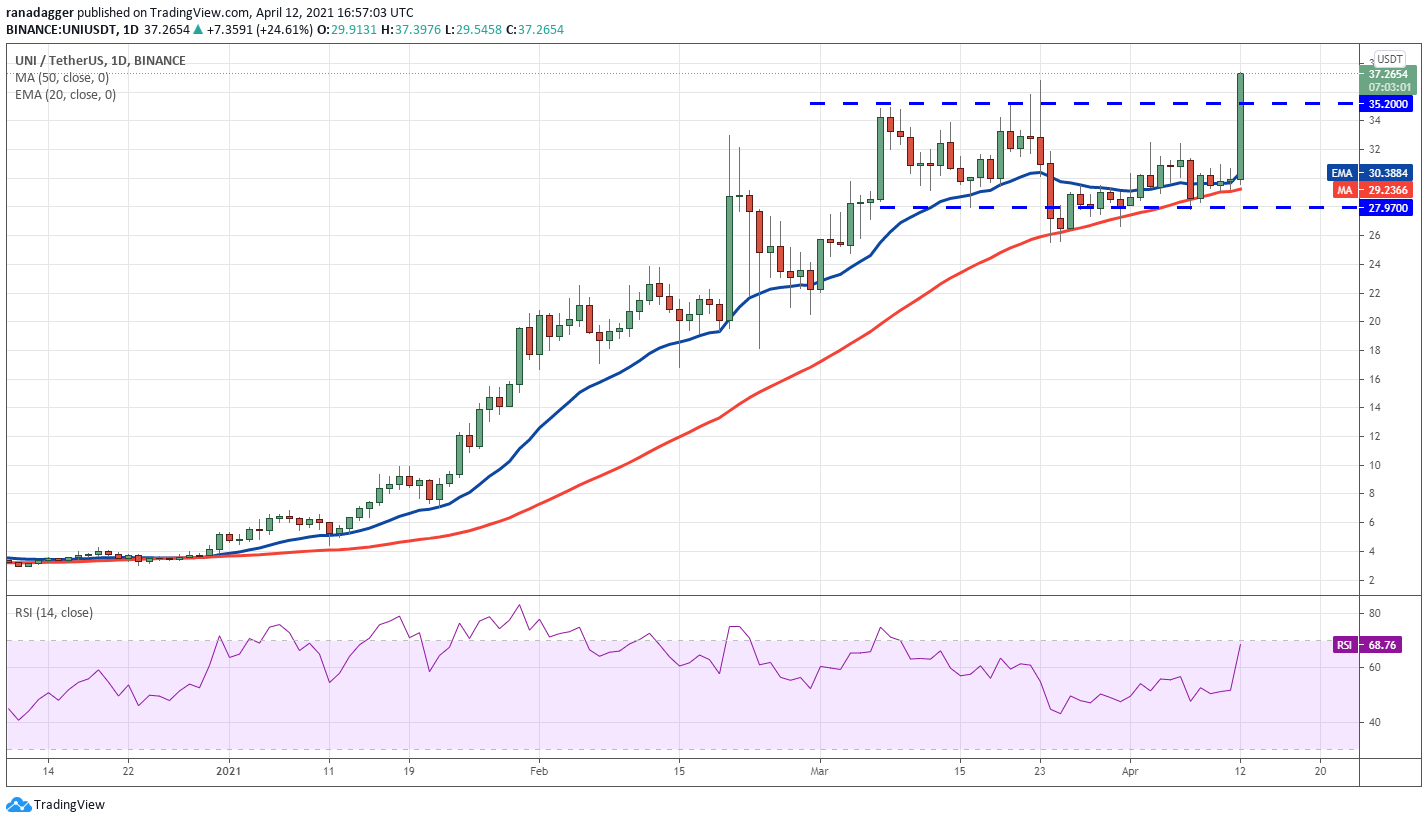
Contrary to this assumption, if the bulls fail to sustain the price above $35.20, it will suggest that traders are booking profits at higher levels. If the price dips and sustains below $35.20, the range-bound action in the pair could continue.
LTC/USDT
Litecoin’s (LTC) volatility contraction on April 8 and 9 was followed by an expansion in favor of the bulls. The buyers pushed the price above $246.96 on April 10 and have successfully managed to sustain the price above it since then.
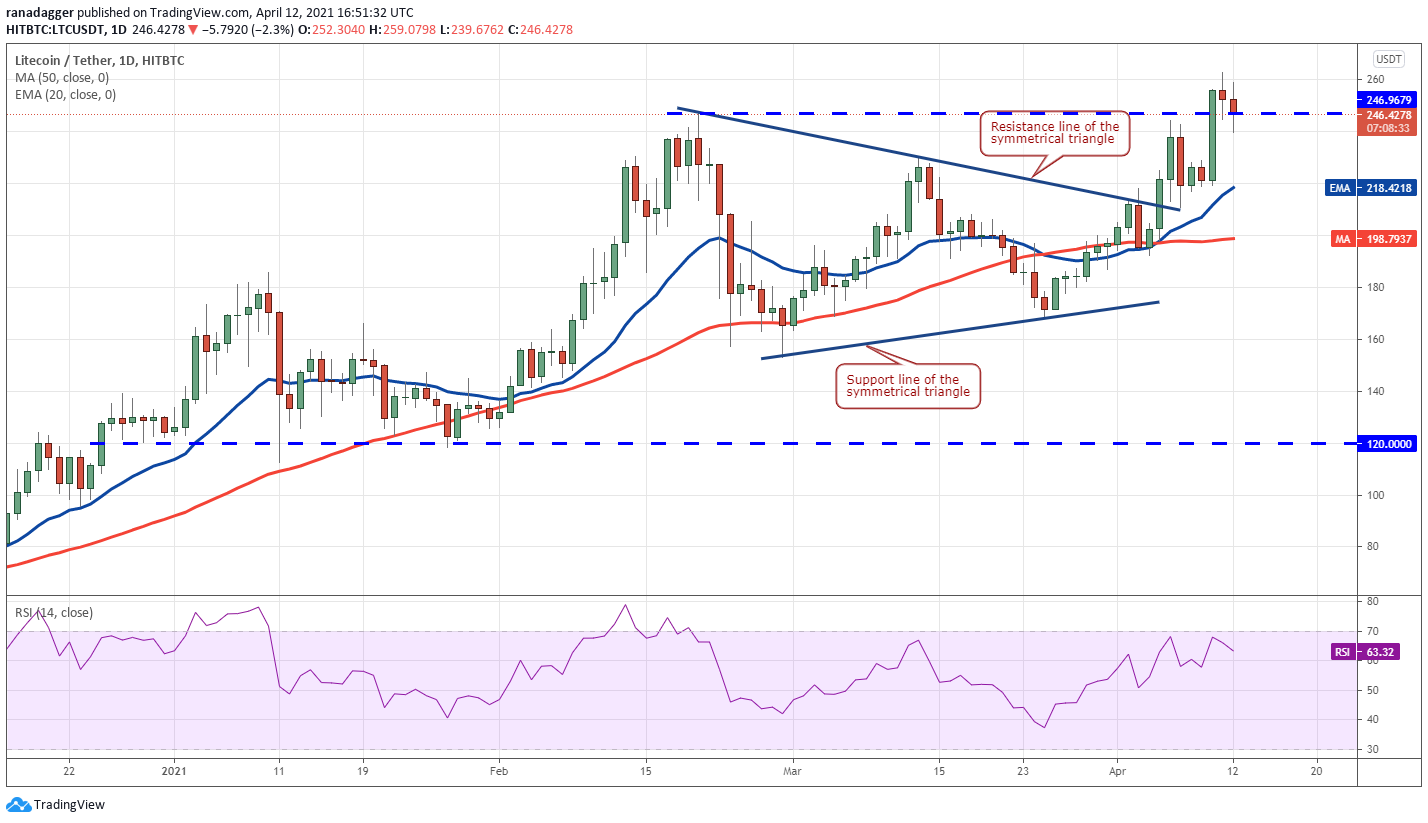
This bullish view will invalidate if the price breaks and sustains below $246.96. Such a move will suggest that traders booked profits at higher levels. The critical support to watch on the downside is the 20-day EMA.
A strong bounce off it will suggest the sentiment remains positive and the bulls will once again try to resume the uptrend. Conversely, a break below the 20-day EMA could pull the price down to $170.
LINK/USDT
Chainlink (LINK) is stuck between $24 and $36.93. The marginally rising 20-day EMA ($30.92) and the RSI above 55 suggest the bulls have a slight edge. However, the failure of the bulls to challenge the $36.93 overhead resistance indicates that demand dries up at higher levels.
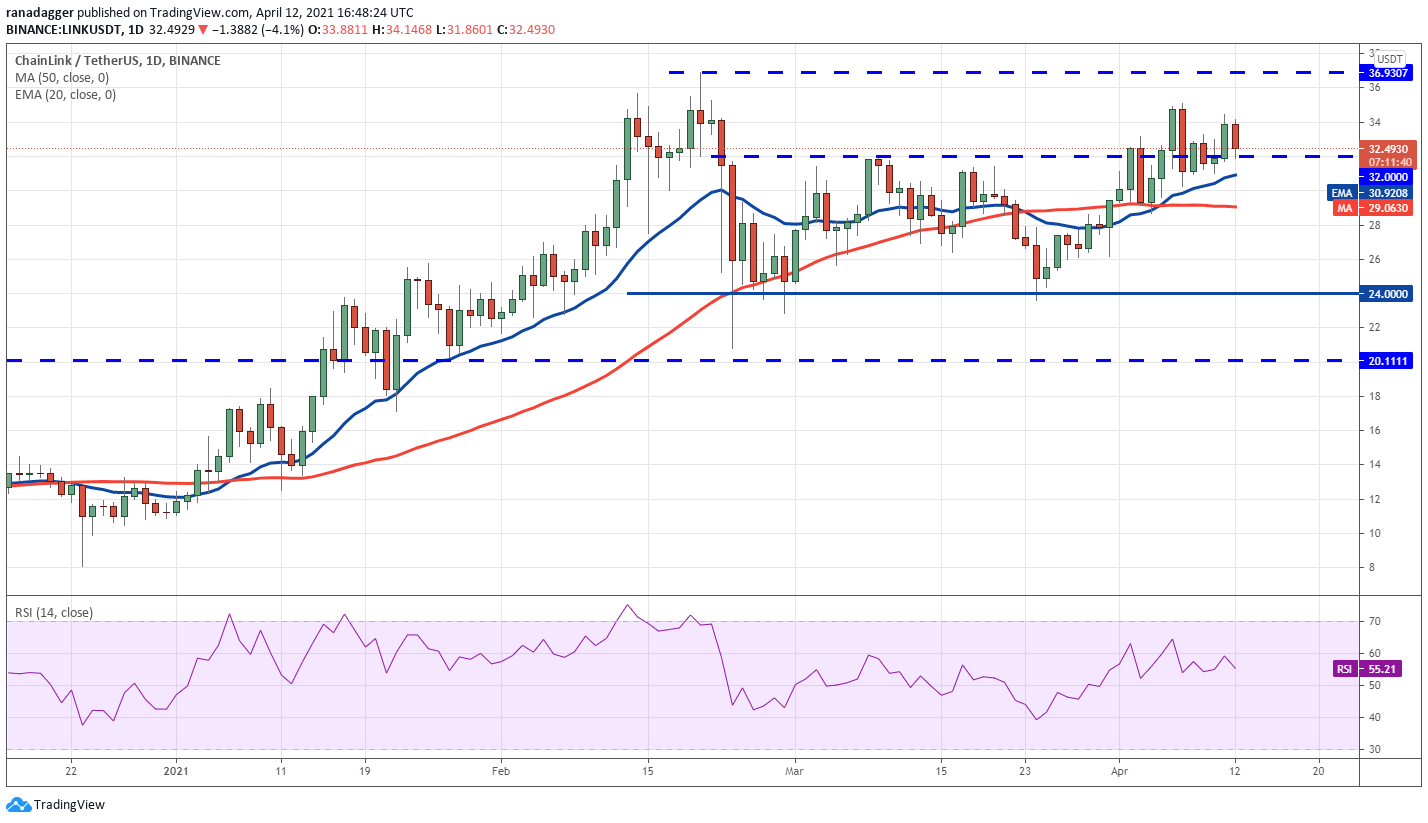
Contrary to this assumption, if the price bounces off the 20-day EMA, the bulls will make one more attempt to drive the price above $36.93. If they succeed, the LINK/USDT pair could resume its uptrend and rally toward $40 and then $50.
XLM/USDT
The bulls are attempting to resume the uptrend in Stellar Lumens (XLM) but they are facing stiff resistance at the $0.60 level. The bulls pushed the price above the overhead resistance on April 11 and today but they could not sustain the breakout.
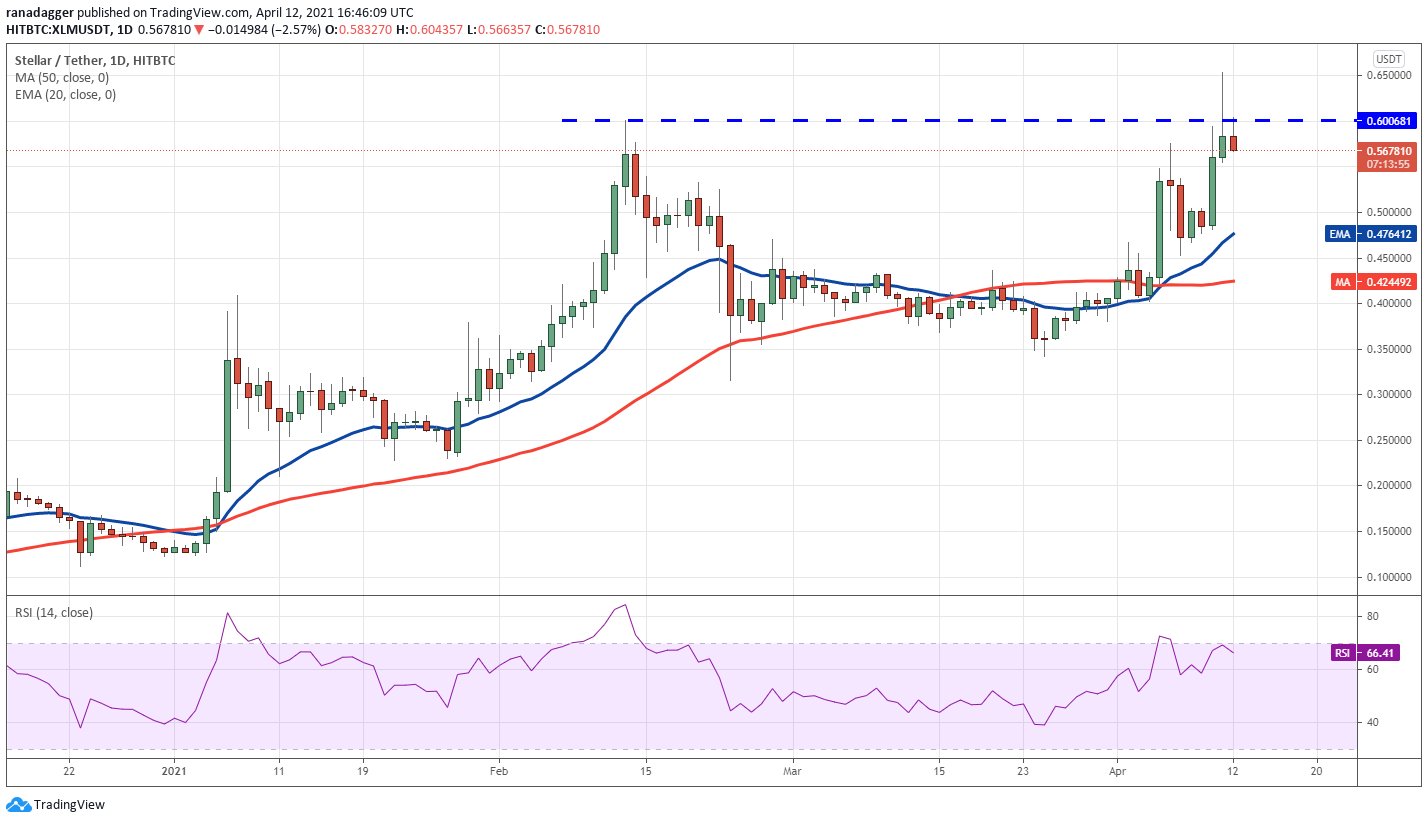
A breakout and close above $0.60 will be the first sign that bulls have overpowered the bears. If that happens, the XLM/USDT pair could resume the uptrend and rally to $0.72 and then $0.85.
On the other hand, if the bears sink the price below $0.55, the pair could drop to the 20-day EMA.
The views and opinions expressed here are solely those of the author and do not necessarily reflect the views of Cointelegraph. Every investment and trading move involves risk. You should conduct your own research when making a decision.
Market data is provided by HitBTC exchange.


Leave A Comment