The United States dollar index (DXY) resumed its strong uptrend on July 11, indicating that investors are preparing for the July 13 CPI report to be hotter than expected. A survey of economists by Bloomberg estimates that in June consumer prices surged to 8.8%, a four-decade high.
Arthur Hayes, the former CEO of derivatives trading platform BitMEX, believes that the U.S. dollar and the euro were moving towards hitting parity. If that happens, the central banks will have to adopt yield curve control, which could lead to the disintegration of the currency and ultimately benefit Bitcoin (BTC).

Although the short-term picture remains skewed to the downside, the long-term view looks encouraging for bulls. Will Bitcoin and the altcoins attract buying at lower levels? Let’s study the charts of the top-10 cryptocurrencies to find out.
BTC/USDT
Bitcoin turned down from $22,527 on July 8 and broke below the 20-day exponential moving average (EMA) ($21,164) on July 10. This suggests that traders who may have bought at lower levels booked profits and the aggressive bears initiated short positions.

A break and close above the 50-day simple moving average (SMA) ($24,496) will suggest that the pair may have bottomed out.
Conversely, if the price breaks below the support line, it will indicate that bears are in control. The sellers will then attempt to sink the pair to the strong support zone between $18,626 and $17,622.
ETH/USDT
Ether (ETH) turned down from the overhead resistance at $1,280 on July 8, suggesting that the bears are defending the level aggressively. The sellers pulled the price below the 20-day EMA ($1,192) on July 10 and are attempting to break the support line of the triangle on July 11.
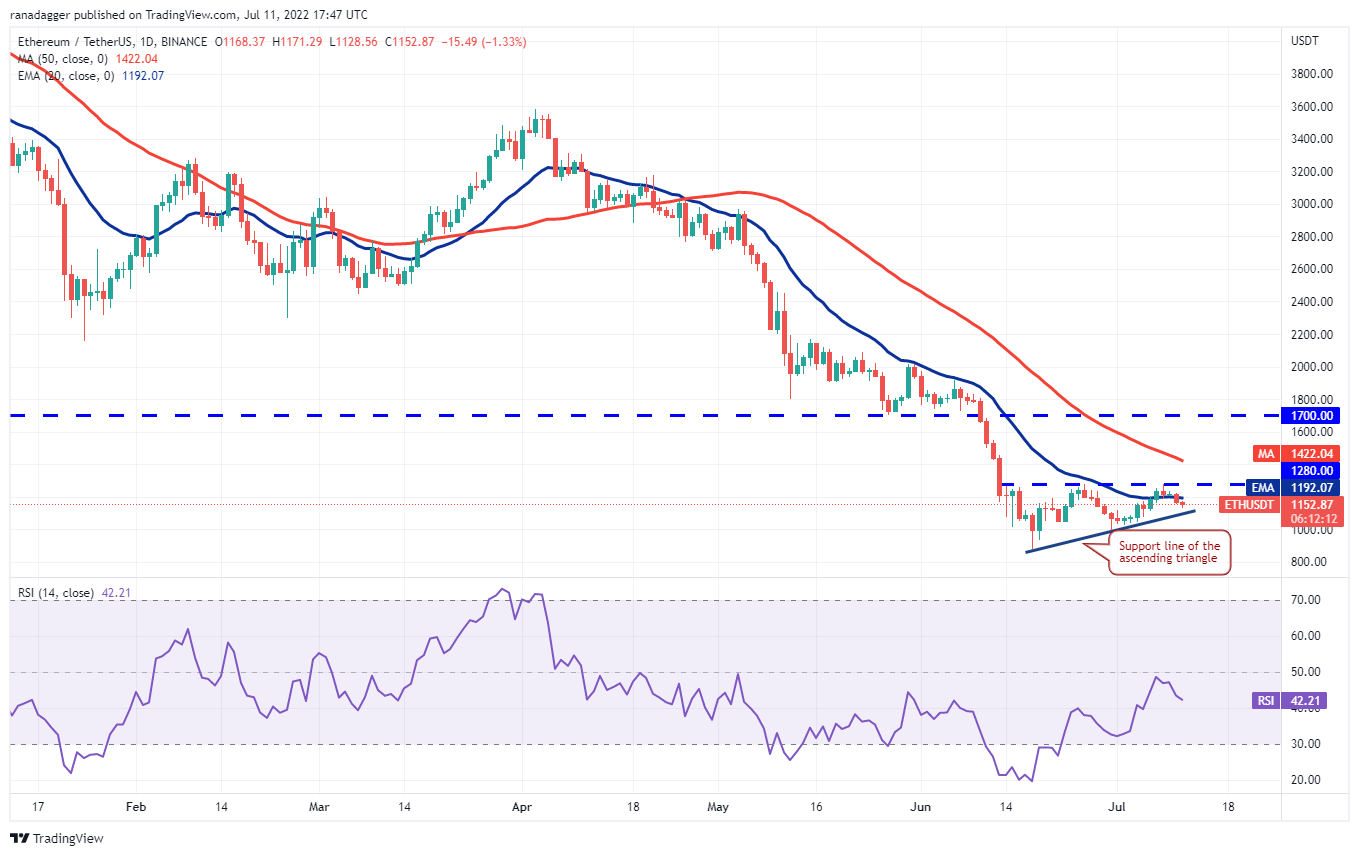
Contrary to this assumption, if the price rebounds off the support line, it will suggest that the bulls are accumulating on dips. The buyers will have to push and sustain the price above $1,280 to gain the upper hand in the near term. The pair could then rise to the 50-day SMA ($1,422) and later rally to the pattern target at $1,679.
BNB/USDT
BNB failure to rise to the 50-day SMA ($257) may have attracted profit-booking from short-term traders. That has pulled the price below the 20-day EMA ($234).

The bulls will then make another attempt to push the price above the 50-day SMA. If they succeed, it will signal that the pair may have bottomed out. This positive view could invalidate if the price breaks below $211.
XRP/USDT
Ripple (XRP) failed to rise above the resistance line of the symmetrical triangle on July 8, indicating that the bears are selling on rallies. Strong selling on July 10 pulled the price to the support line of the triangle.
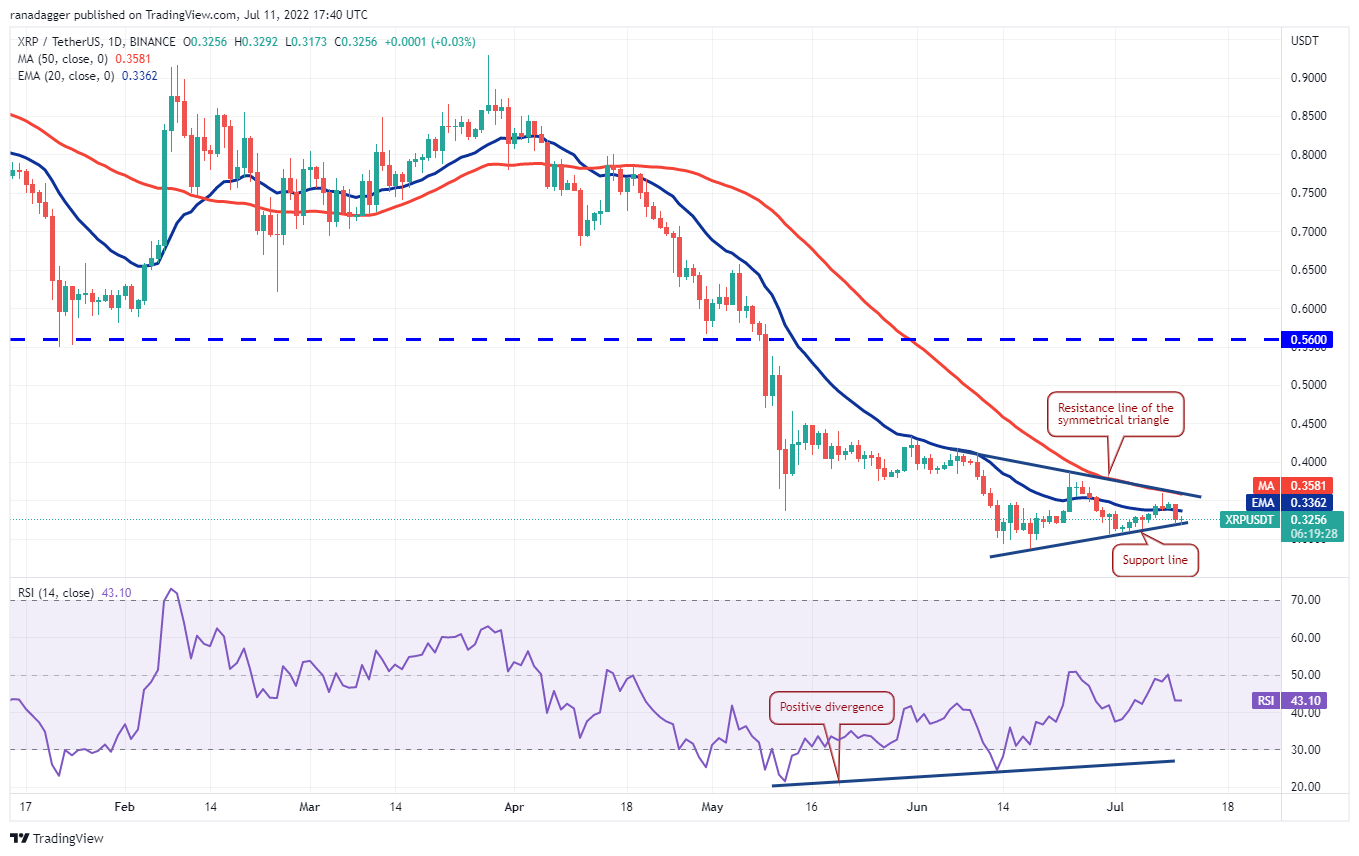
If the price rebounds off the support line, it will suggest that the bulls continue to buy on dips. The buyers will then make another attempt to push the price above the triangle and gain the upper hand. If that happens, the pair could rise to $0.41.
ADA/USDT
Cardano’s (ADA) failure to sustain above the 20-day EMA ($0.47) suggests that the bears are defending this level aggressively. The sellers have pulled the price to the immediate support at $0.44.
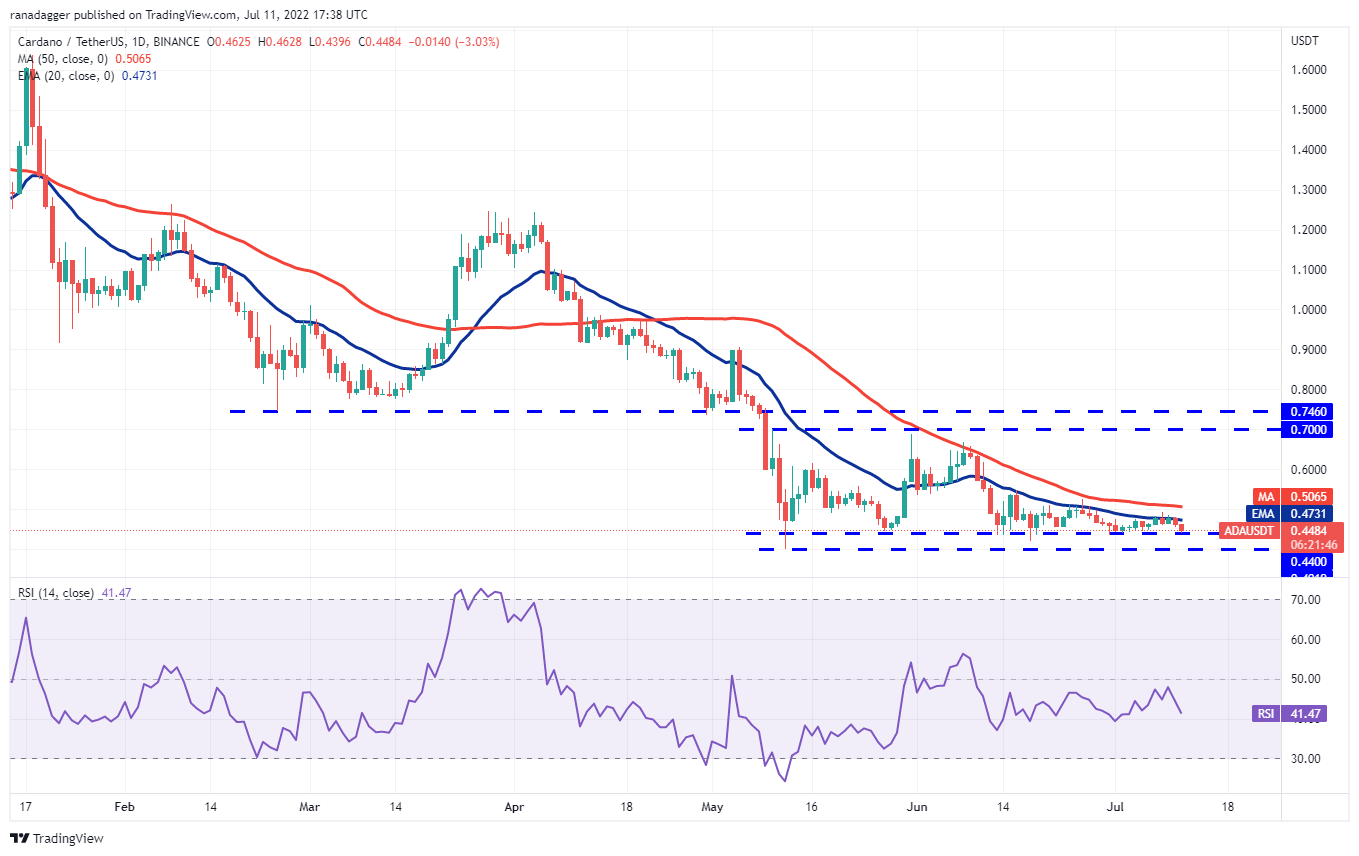
The bulls are expected to defend the zone between $0.40 and $0.44 with vigor. If the price rebounds off this zone with strength, the buyers will again attempt to clear the overhead hurdle at the moving averages.
SOL/USDT
Solana (SOL) broke below the 20-day EMA ($36) on July 11 and has dropped to the support line of the symmetrical triangle pattern. The price is reaching close to the apex of the triangle, indicating the possibility of a breakout within the next few days.
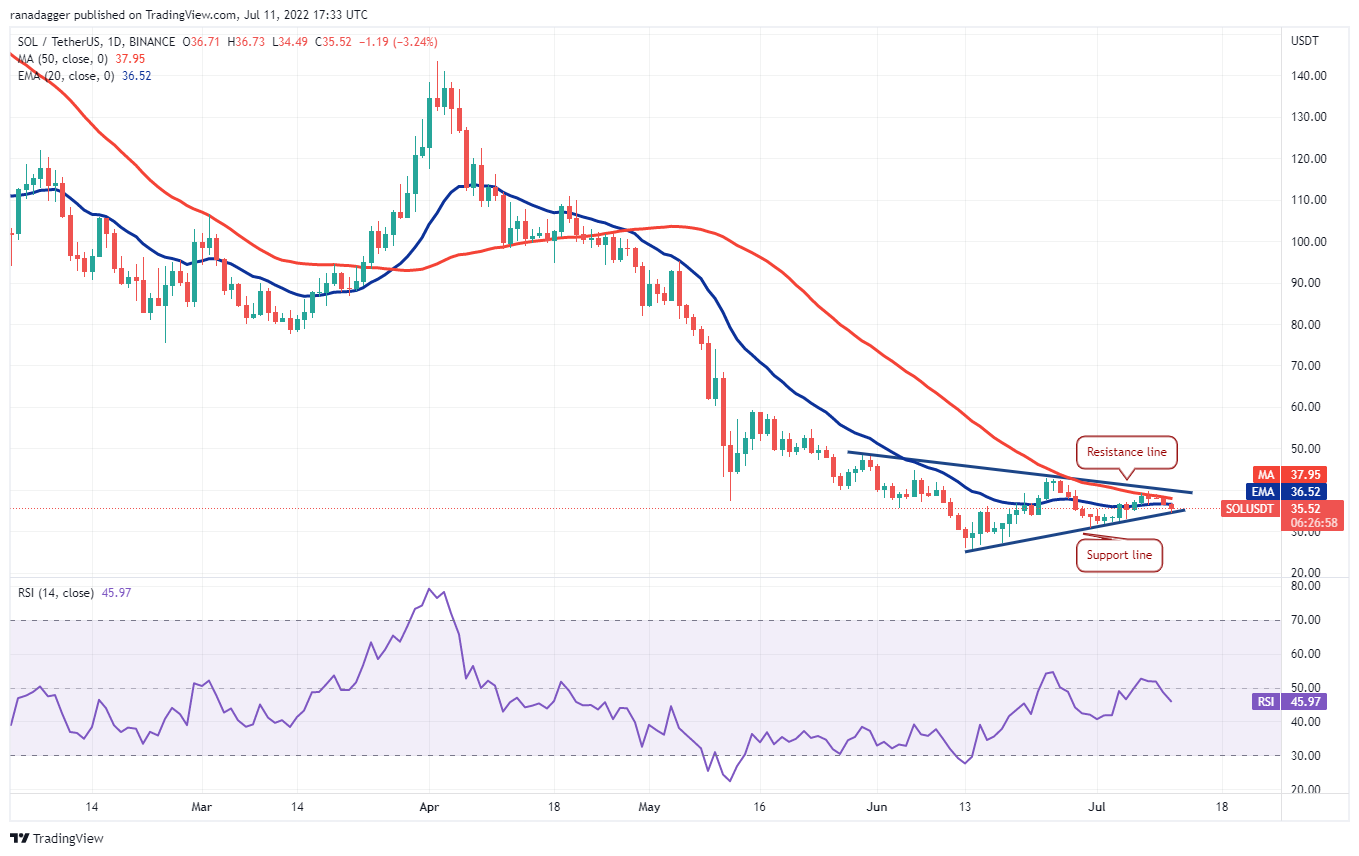
Conversely, if the price rises from the current level, it will suggest that the bulls are attempting to defend the support line. The pair could then rise to the resistance line. The bulls will have to clear this hurdle to start an up-move to $50.
DOGE/USDT
Dogecoin (DOGE) turned down from the 50-day SMA ($0.07) on July 8 and broke below the 20-day EMA ($0.07) on July 10. The bears are attempting to sink the price below the strong support at $0.06.
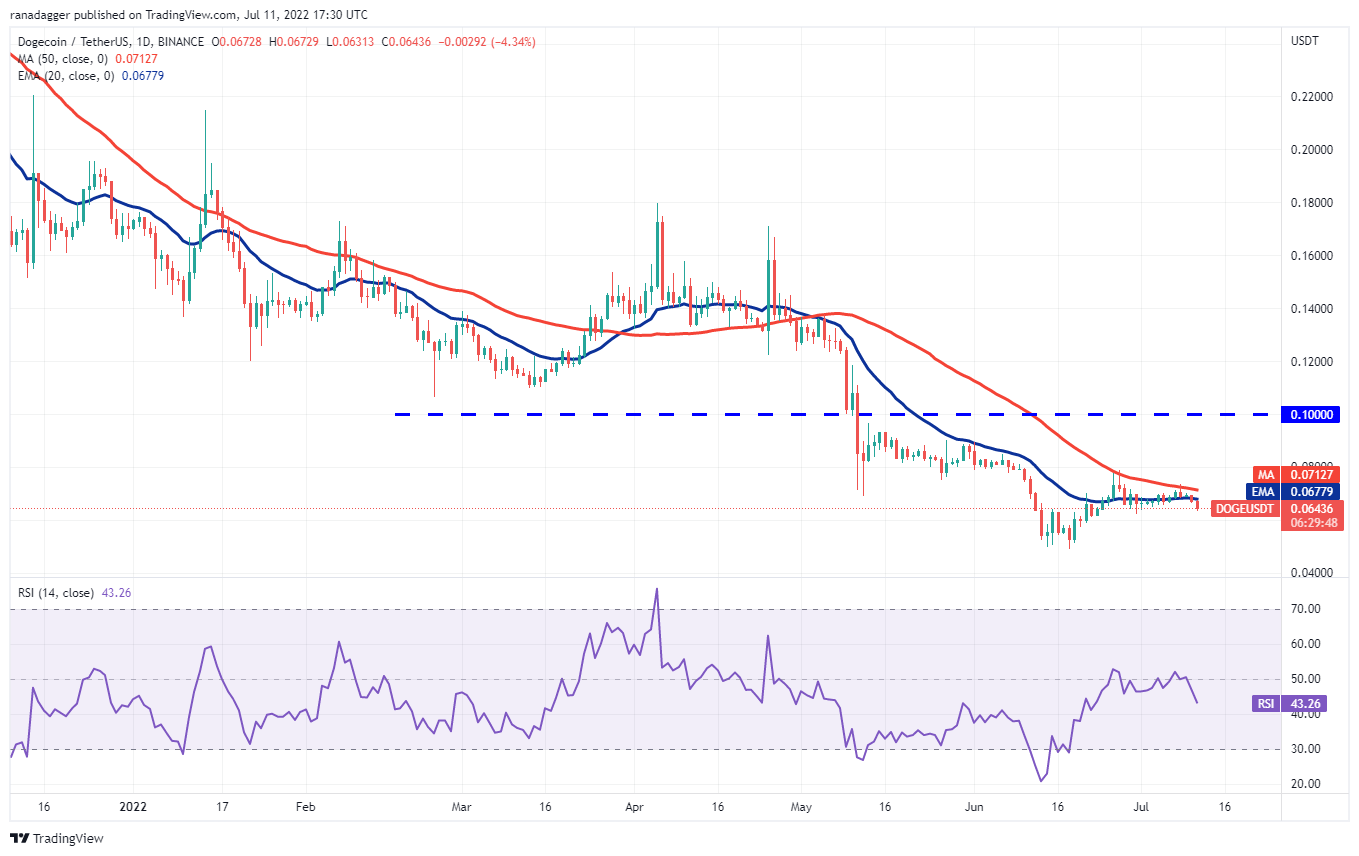
Conversely, if the price rebounds off $0.06, it will suggest buying at lower levels. The bulls will then make another attempt to clear the hurdle at the 50-day SMA and push the pair to $0.08. The next trending move could begin on a break above $0.08 or below $0.06. Until then, random range-bound action is likely to continue.
Related: 3 reasons why Solana can repeat Ethereum’s 2018 fractal to 5,000% gains
DOT/USDT
Polkadot (DOT) turned down from $7.30 on July 10 after bulls repeatedly failed to push the price above the resistance. The bears will attempt to sink the price to the strong support at $6.36.

If bears sink the price below $6.36, the DOT/USDT pair could resume the downtrend. The pair could then drop to $5. Conversely, if the price rises from the current level and breaks above $7.30, the pair could rally to the 50-day SMA ($8.20). A break and close above this level could suggest that the downtrend could be over.
SHIB/USDT
Shiba Inu (SHIB) turned down from the overhead resistance at $0.000012 on July 10, indicating that bears are active at higher levels. The sellers will try to pull the price to $0.000010.
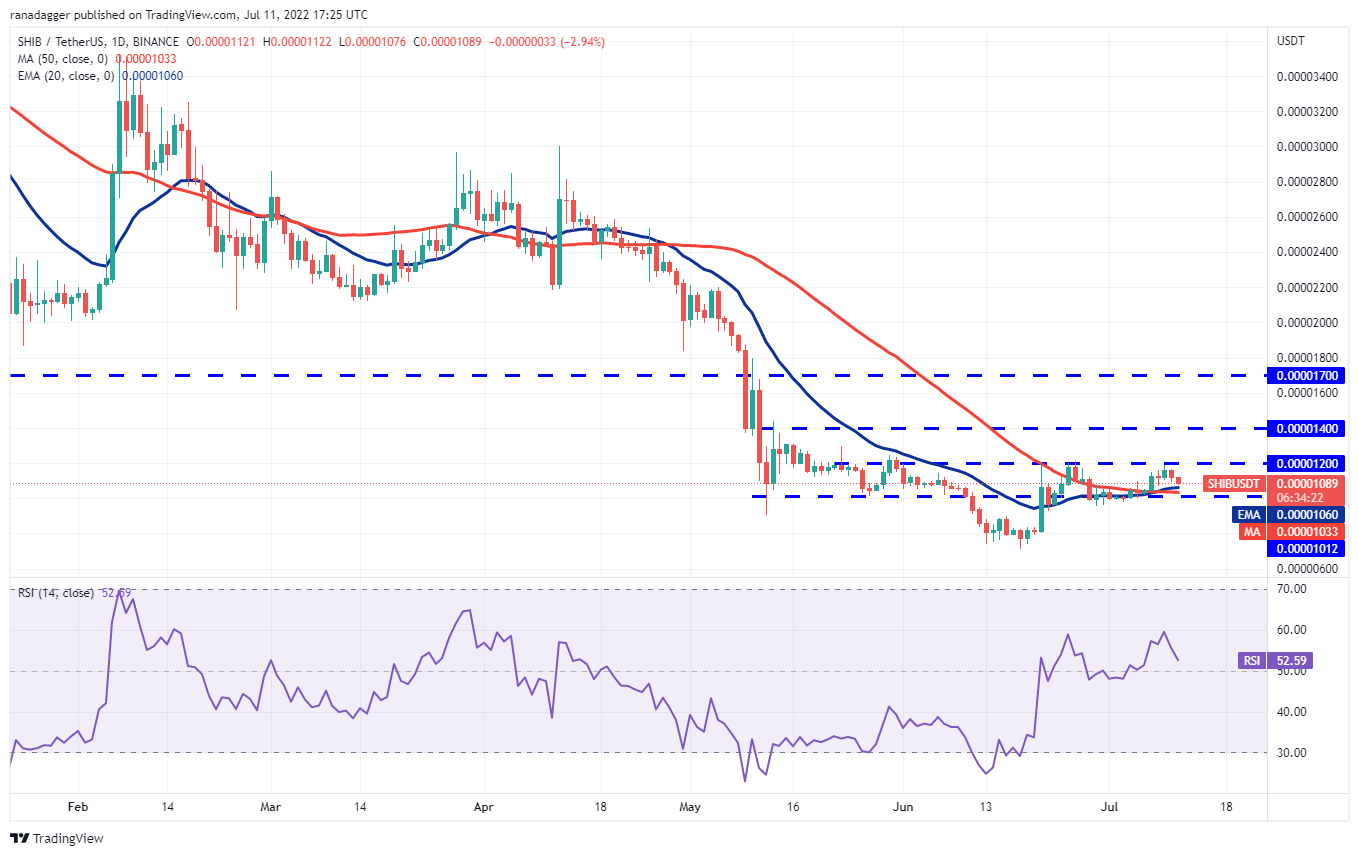
Alternatively, if the price rebounds off $0.000010 but fails to climb above $0.000012, then it will point to a consolidation in the near term. The bears may gain the upper hand if the price slips below $0.000010. The pair could then decline to $0.000009.
AVAX/USDT
Avalanche (AVAX) turned down from the overhead resistance at $21.35 on July 8, indicating that bears continue to defend the level aggressively. The bears are attempting to extend their short-term advantage by pulling the price below the 20-day EMA ($18.83).
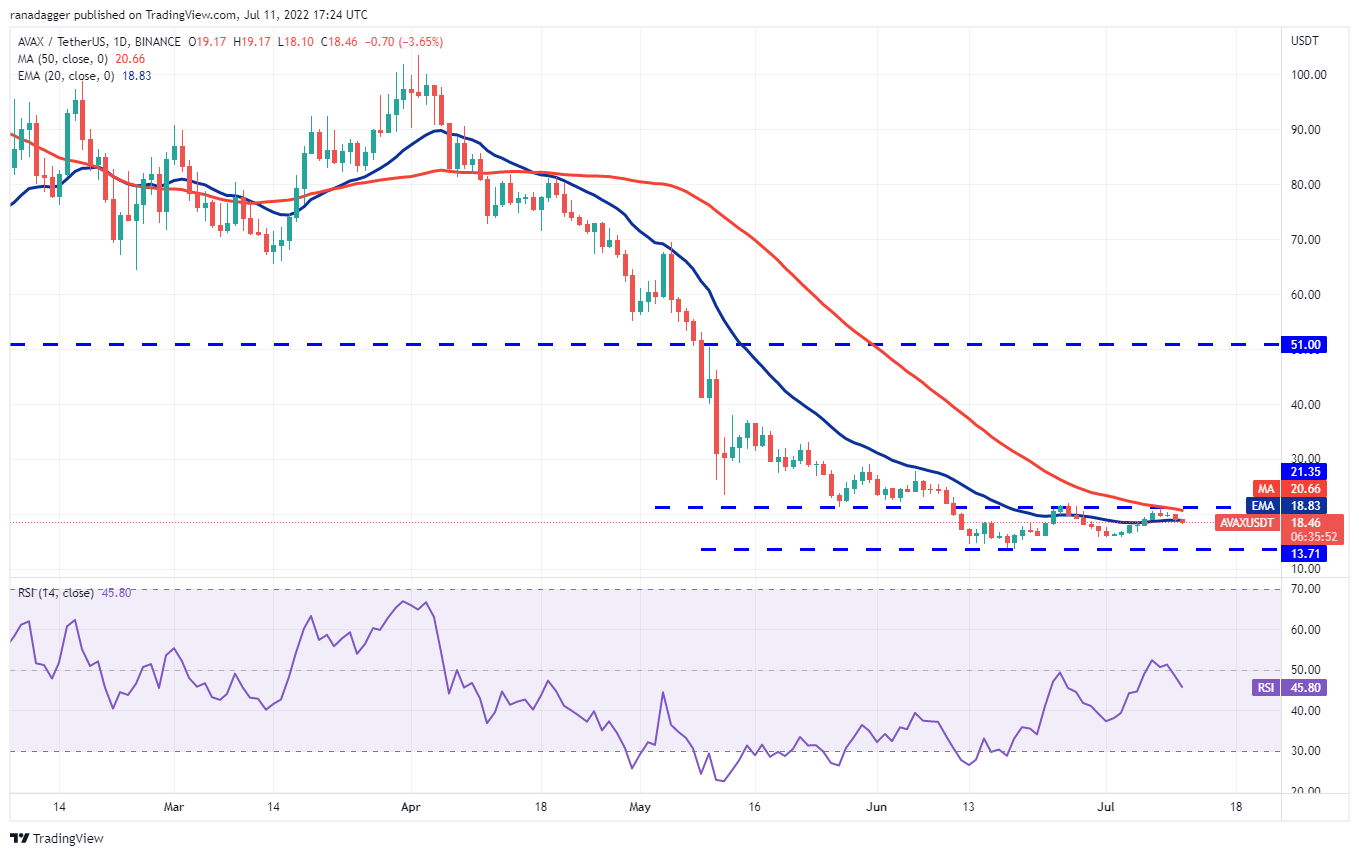
The first sign of strength will be a break and close above $21.35. Such a move could signal the start of a new up-move. The pair could then rally to $29 where the bears may again mount a strong resistance.
The views and opinions expressed here are solely those of the author and do not necessarily reflect the views of Cointelegraph. Every investment and trading move involves risk. You should conduct your own research when making a decision.
Market data is provided by HitBTC exchange.


Leave A Comment