Bitcoin is still struggling to stay above $31,000.
While a tight consolidation near the overhead resistance is a positive sign, the failure to rise above it may result in short-term liquidations. However, a shallow pullback should not be considered a trend change because, many times, the bulls take a step back to regroup and launch another attack at the resistance. If the barrier is overcome, the positive momentum picks up.
Binance CEO Changpeng “CZ” Zhao said in an “ask me anything” session on Twitter that Bitcoin (BTC) could witness a bull year after its halving in 2024. CZ added that BlackRock’s foray into cryptocurrencies will be “hugely beneficial” for the industry.
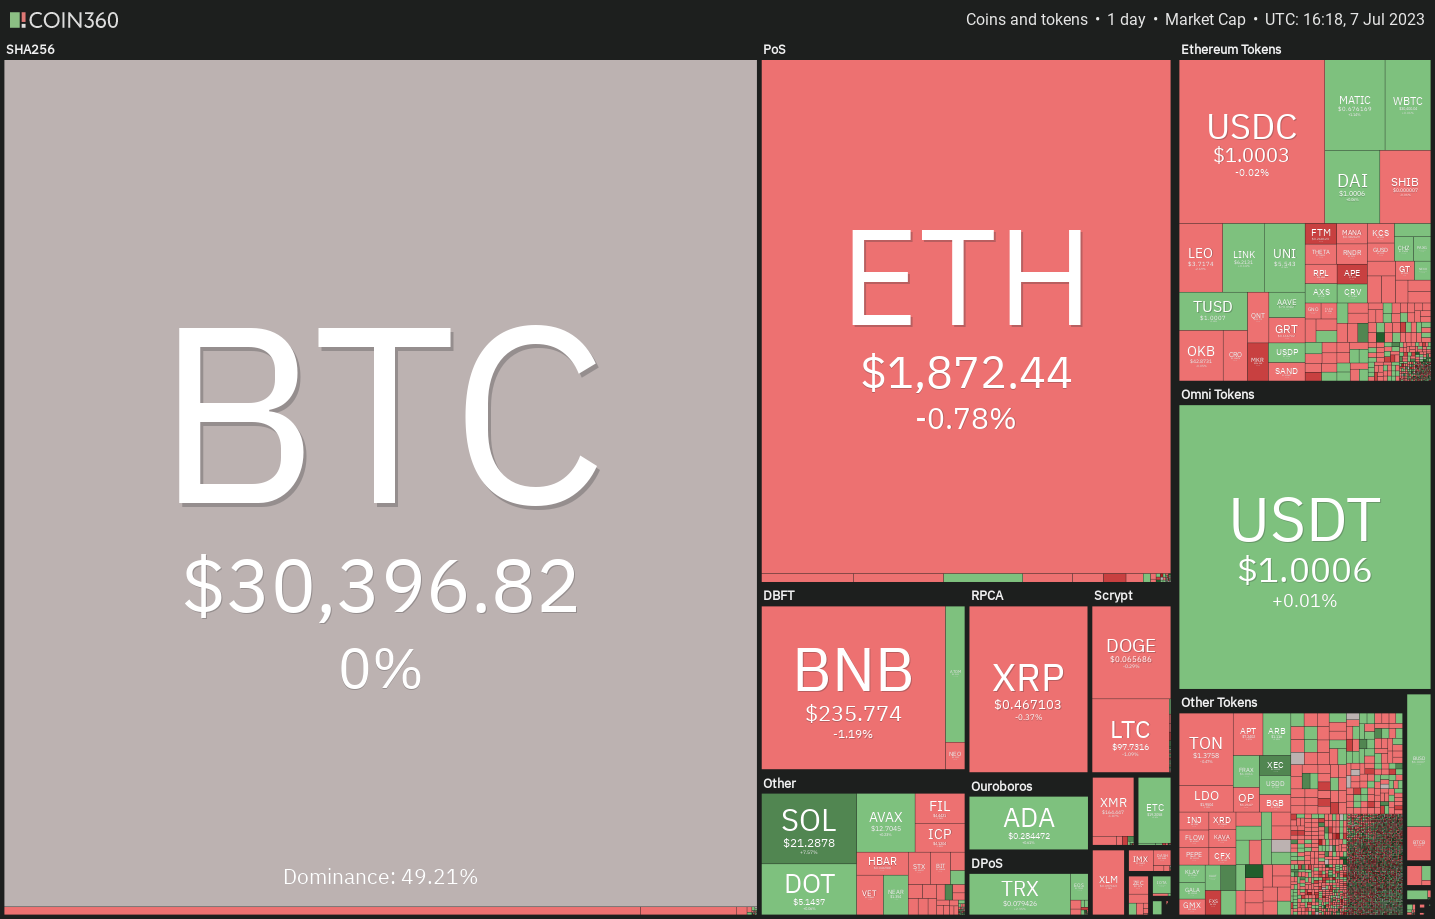
Could positive comments from Fink act as a floor during pullbacks? What are the important overhead resistance levels in Bitcoin and altcoins that need to be crossed to signal the start of a short-term up move? Let’s study the charts of the top 10 cryptocurrencies to find out.
Bitcoin price analysis
Bitcoin once again rose above $31,000 on July 6, but the rally was met with strong selling pressure from the bears. That pulled the price down to the 20-day exponential moving average (EMA) at $29,763.
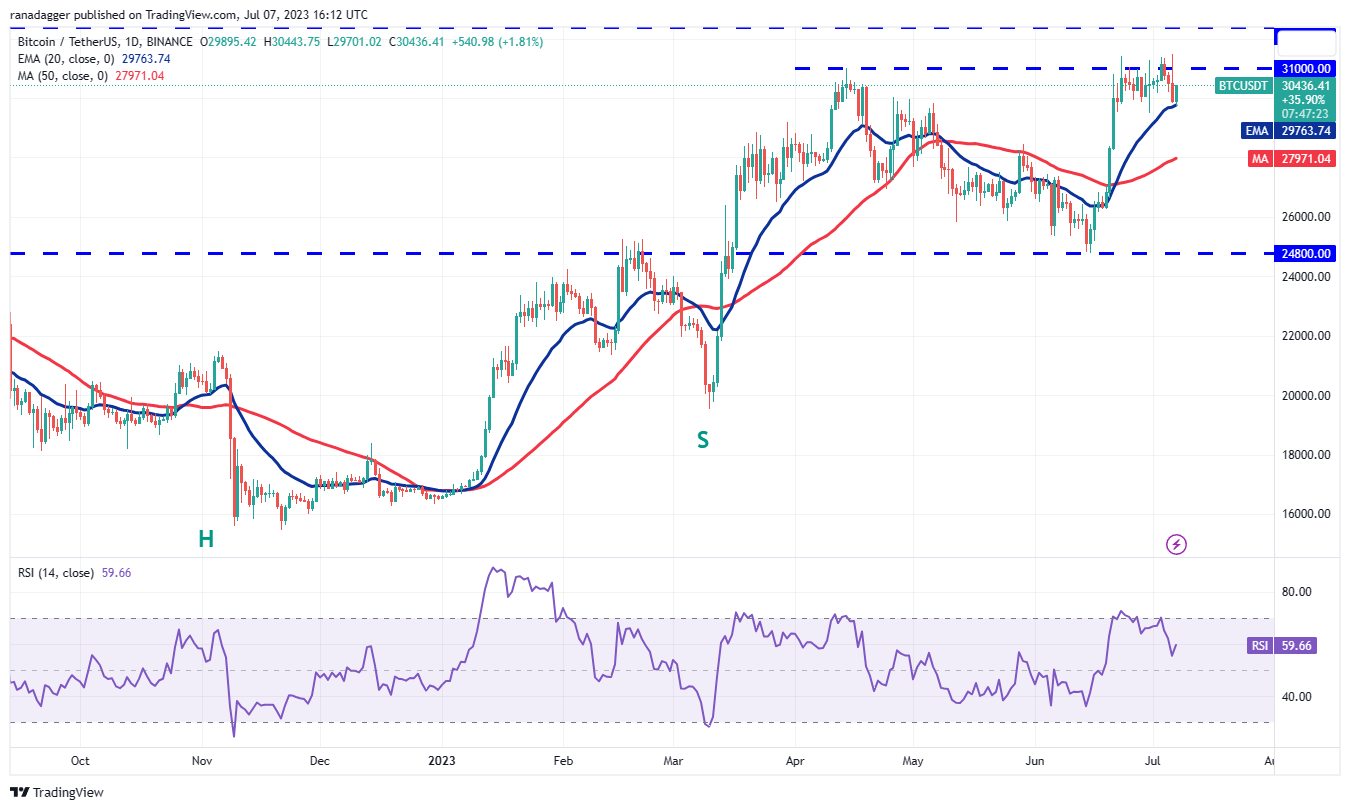
If that happens, the pair could start an upward march to $40,000. The bears will attempt to stall the up move at $32,400, but the buyers are expected to bulldoze their way through.
Conversely, if the price turns down and breaks below the 20-day EMA, it will suggest that bears have the upper hand. The pair may then dump to the 50-day simple moving average (SMA) of $27,971.
Ether price analysis
The long wick on Ether’s (ETH) July 6 candlestick shows that the bears are aggressively guarding the psychological resistance at $2,000.
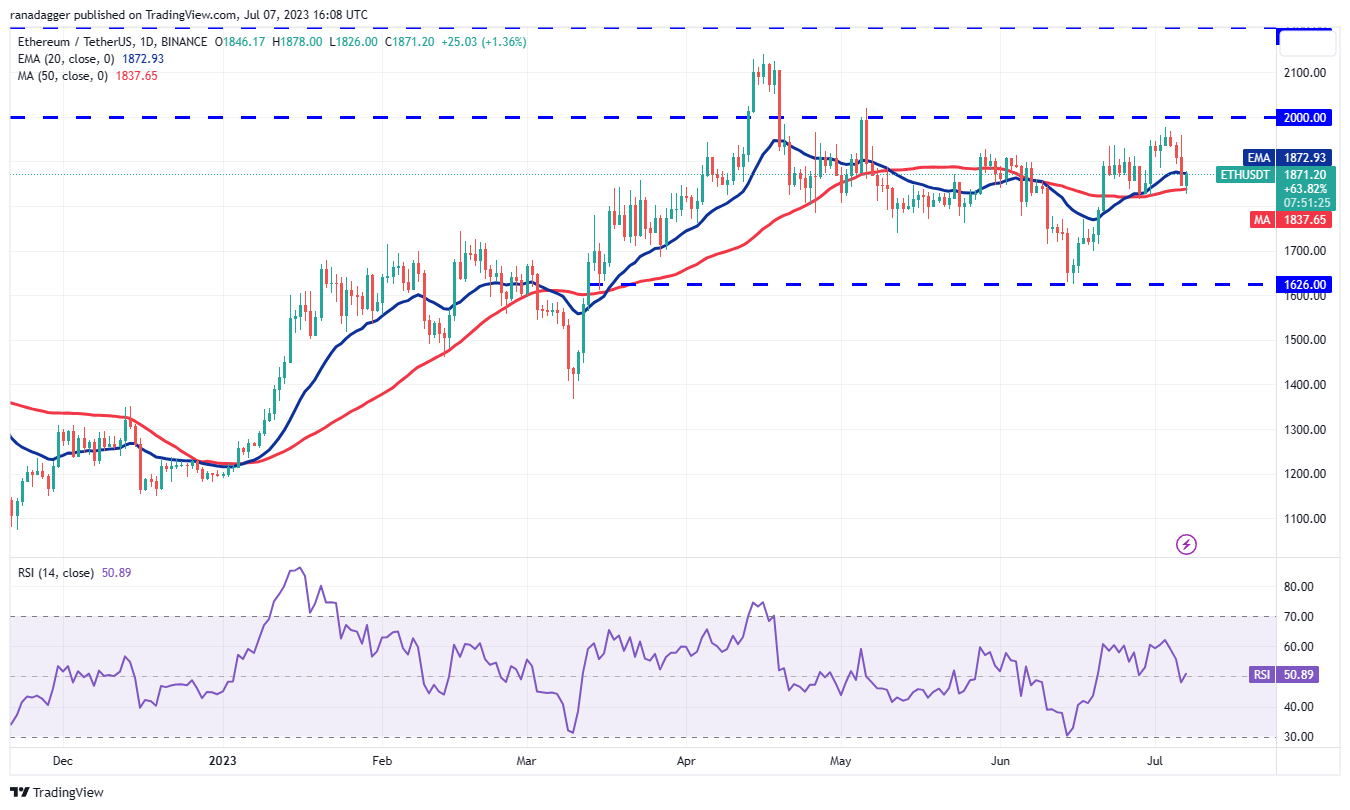
On the contrary, if the price turns up from the current level and maintains above the 20-day EMA ($1,872), it will suggest strong buying at the 50-day SMA. The bulls will then again try to push the price above $2,000.
BNB price analysis
BNB (BNB) has been consolidating between $257 and $220 for the past few days. This suggests that the bears are using the relief rallies to sell while the bulls are buying the dips.
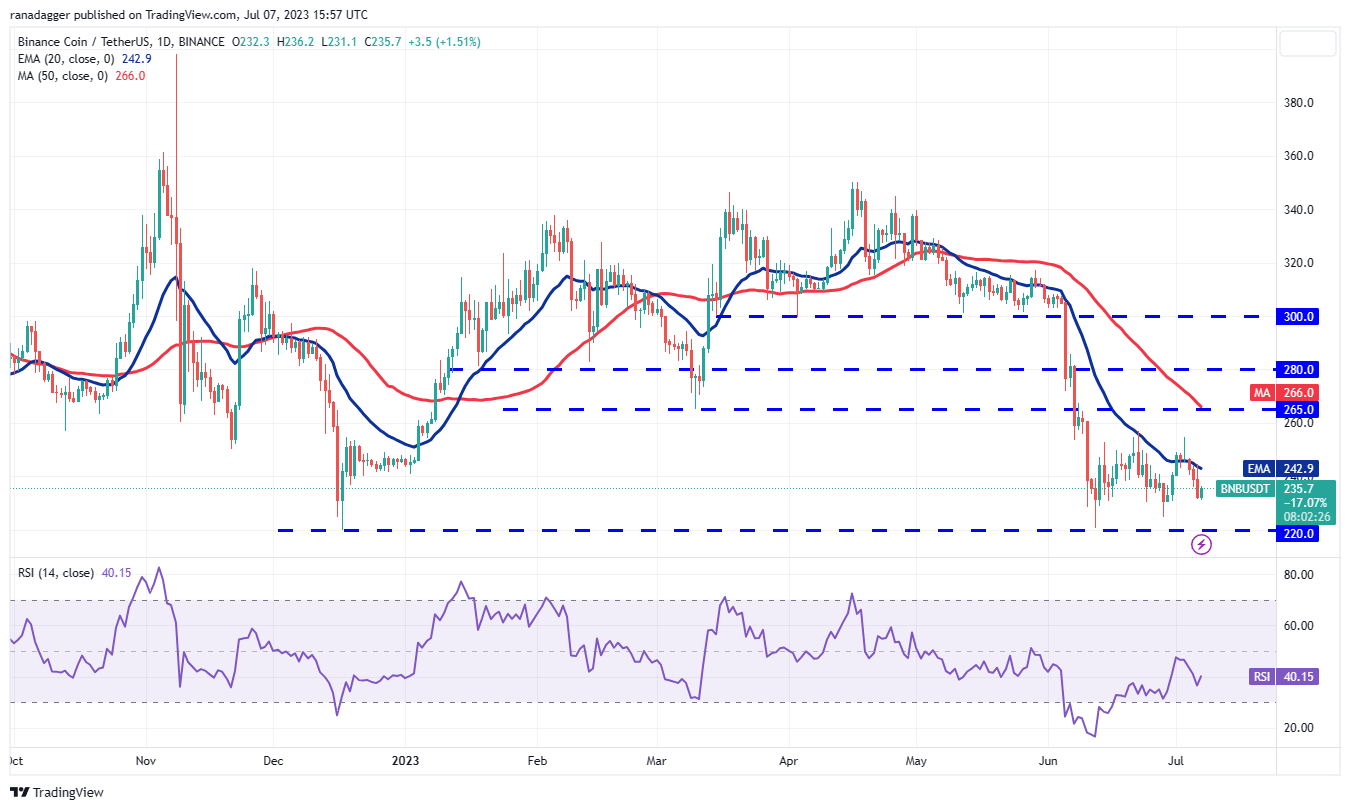
On the upside, the bulls will have to propel the price above $257 to suggest the start of a sustained recovery. The $265 level may act as a barrier, but it is likely to be crossed. The pair may then surge to $280.
XRP price analysis
XRP (XRP) has been trading between the 20-day EMA ($0.48) and the horizontal support at $0.45 for the past few days. This shows that the bears are selling on rallies, but supply is being lapped up at lower levels.
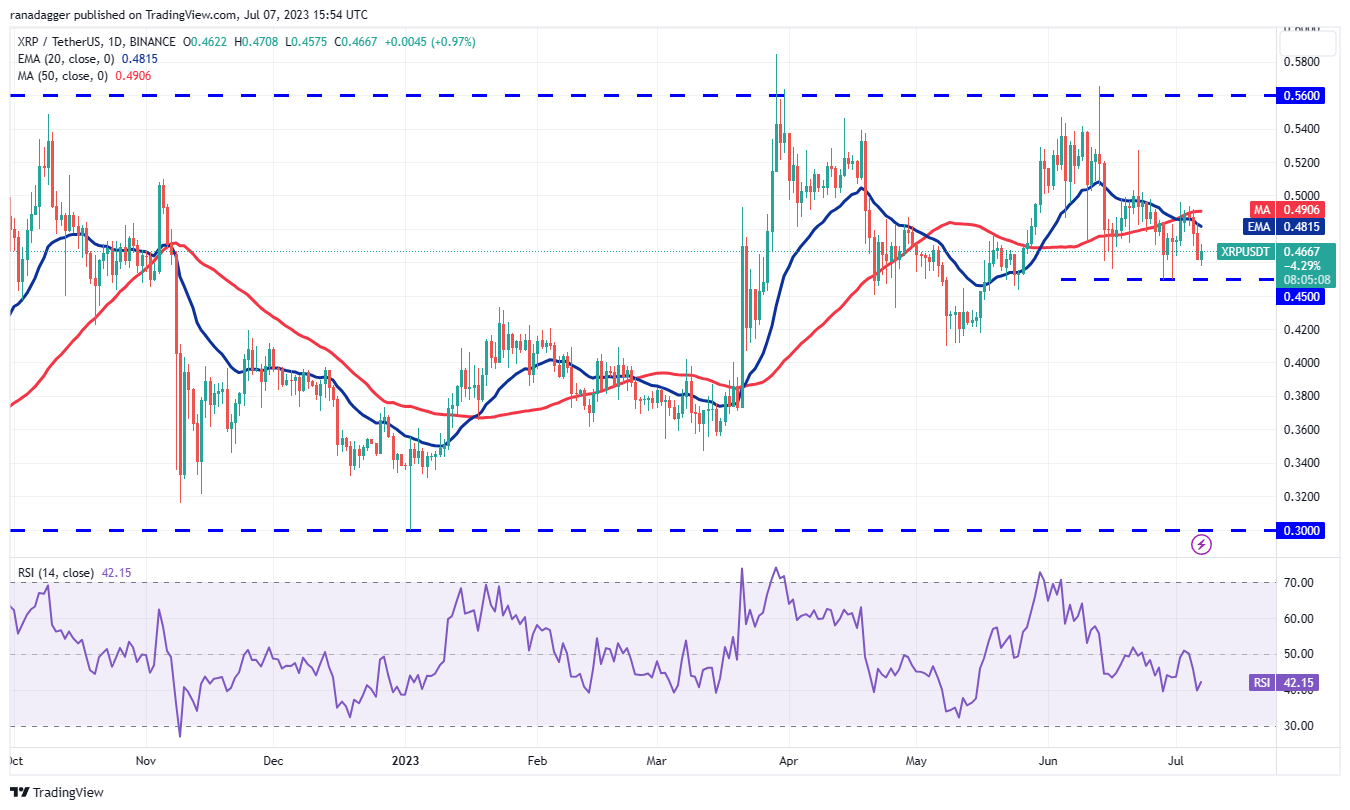
Alternatively, if the price turns up from the current level, the bulls will try to overcome the obstacle at the moving averages. If they manage to do that, the XRP/USDT pair could start its march toward $0.56.
Cardano price analysis
Cardano (ADA) has been trading between $0.30 and $0.24 for the past few days. Generally, inside a range, traders buy near the support and sell close to the resistance.
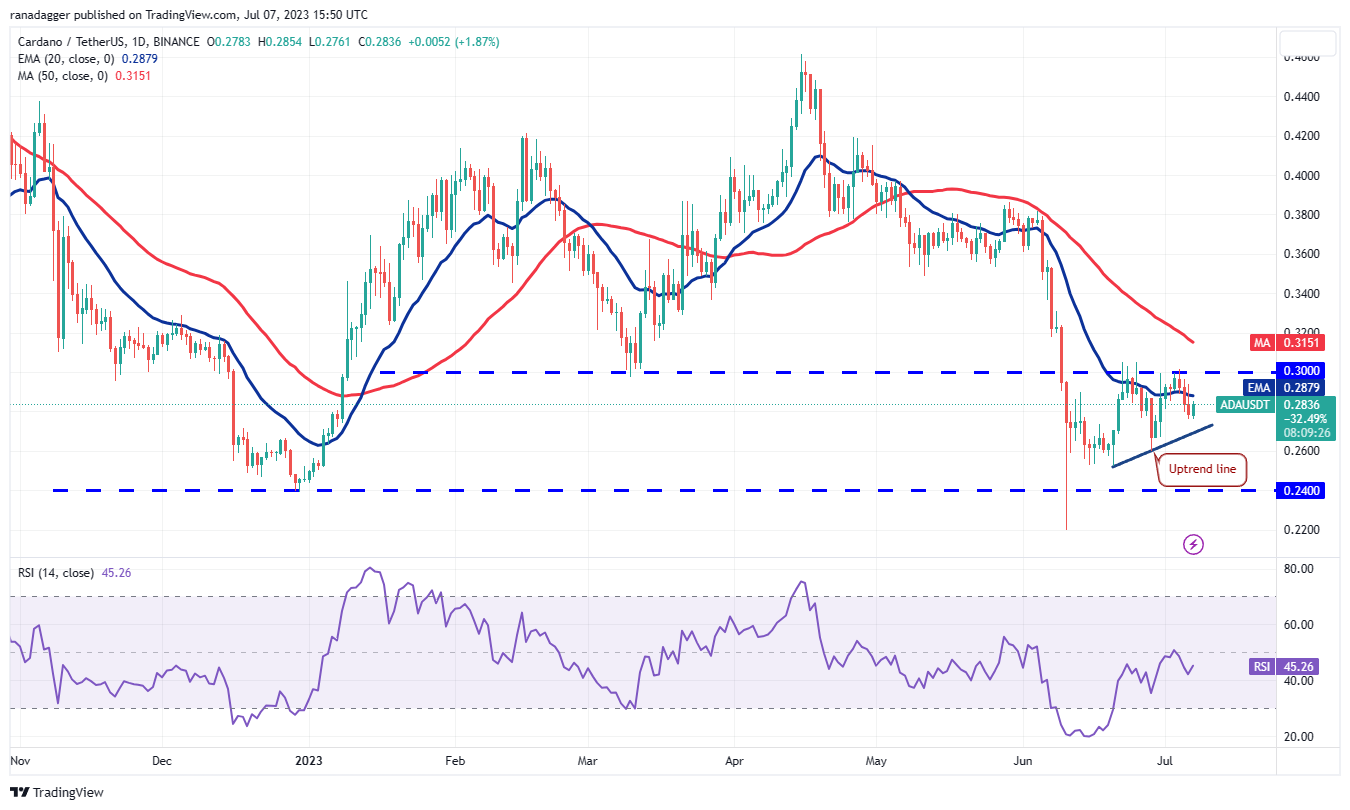
If they succeed, the pair may start an up move to $0.38. The 50-day SMA ($0.31) may act as a barrier, but it is likely to be crossed.
Contrarily, a break below the uptrend line could open the doors for a potential drop to the support at $0.25.
Dogecoin price analysis
The failure to propel Dogecoin (DOGE) above the overhead resistance of $0.07 on July 4 may have attracted profit-booking from the short-term bulls.
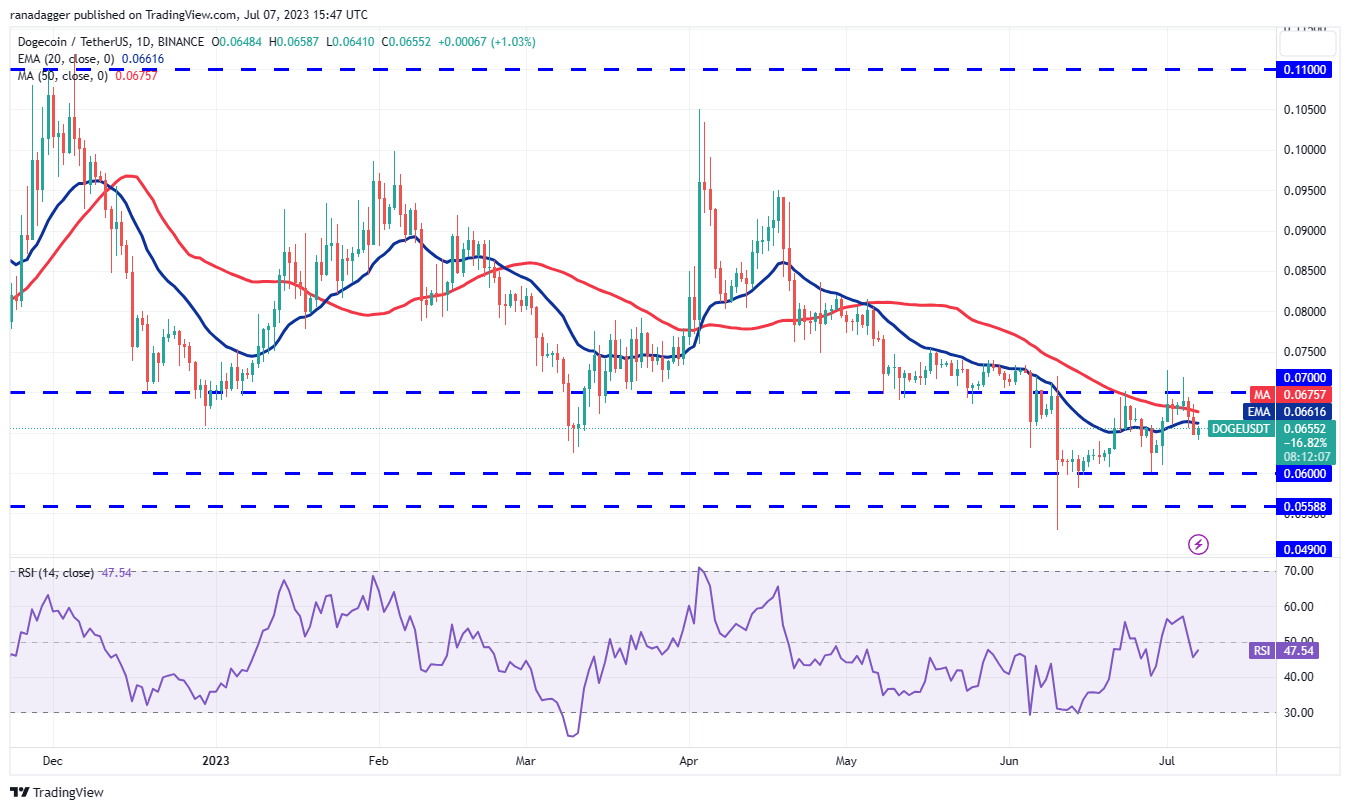
The bulls will have to push and sustain the price above the overhead resistance of $0.07 to seize control. That could pave the way for a rally to $0.08 and then to $0.10. On the downside, a break below $0.06 could resume the down move. The pair may then slump to $0.05.
Solana price analysis
Solana (SOL) bounced off the 50-day SMA ($18.34) on July 5, indicating that every minor dip is being purchased. The bulls have pushed the price above the downtrend line, indicating that the short-term corrective phase may be ending.
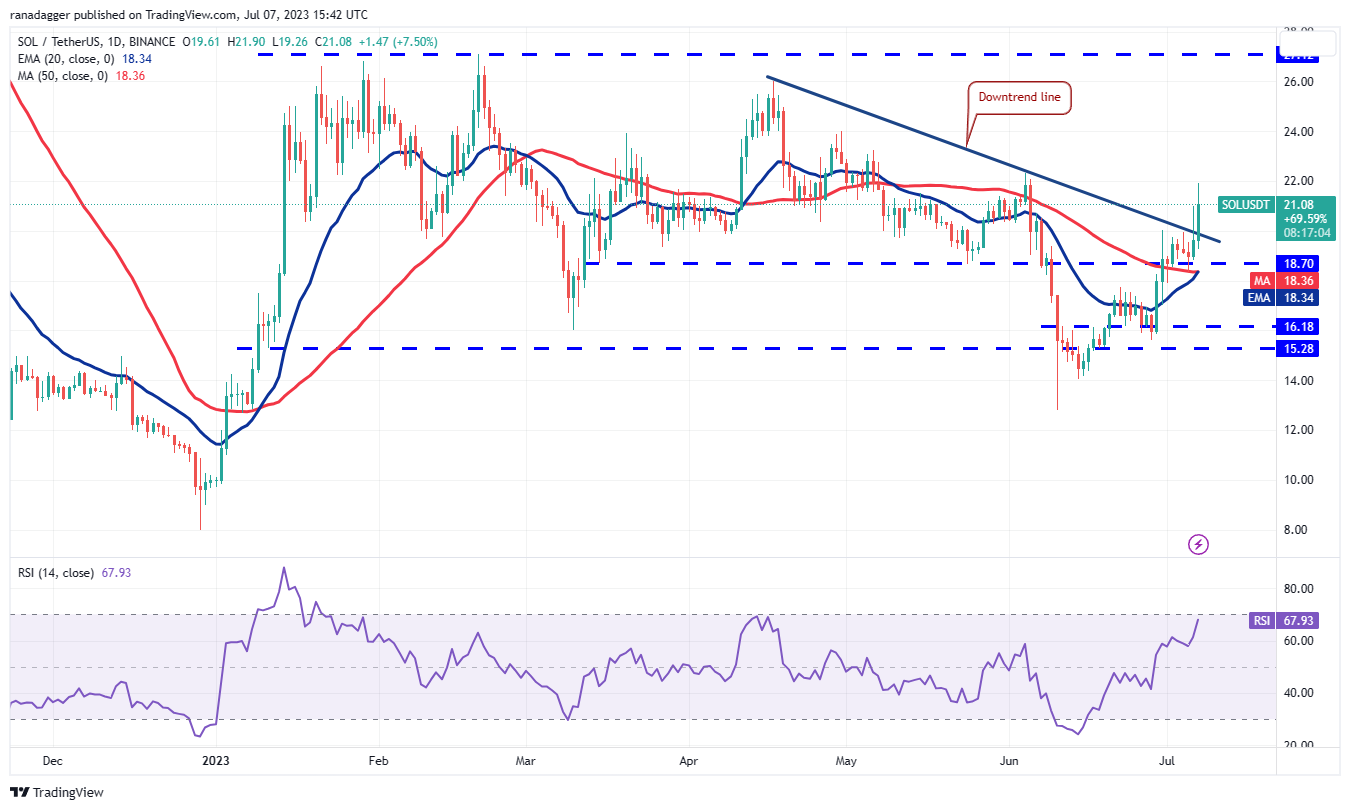
If bears want to gain the upper hand, they will have to yank the price below the moving averages. That may catch the aggressive bulls off guard, resulting in a drop to the strong support zone between $16.18 and $15.28.
Related: AI has potential to send Bitcoin price over $750K — Arthur Hayes
Litecoin price analysis
The bulls tried to push Litecoin (LTC) above the overhead resistance of $106 on July 5 and 6, but the long wick on the candlesticks shows that the bears fiercely defended the level.
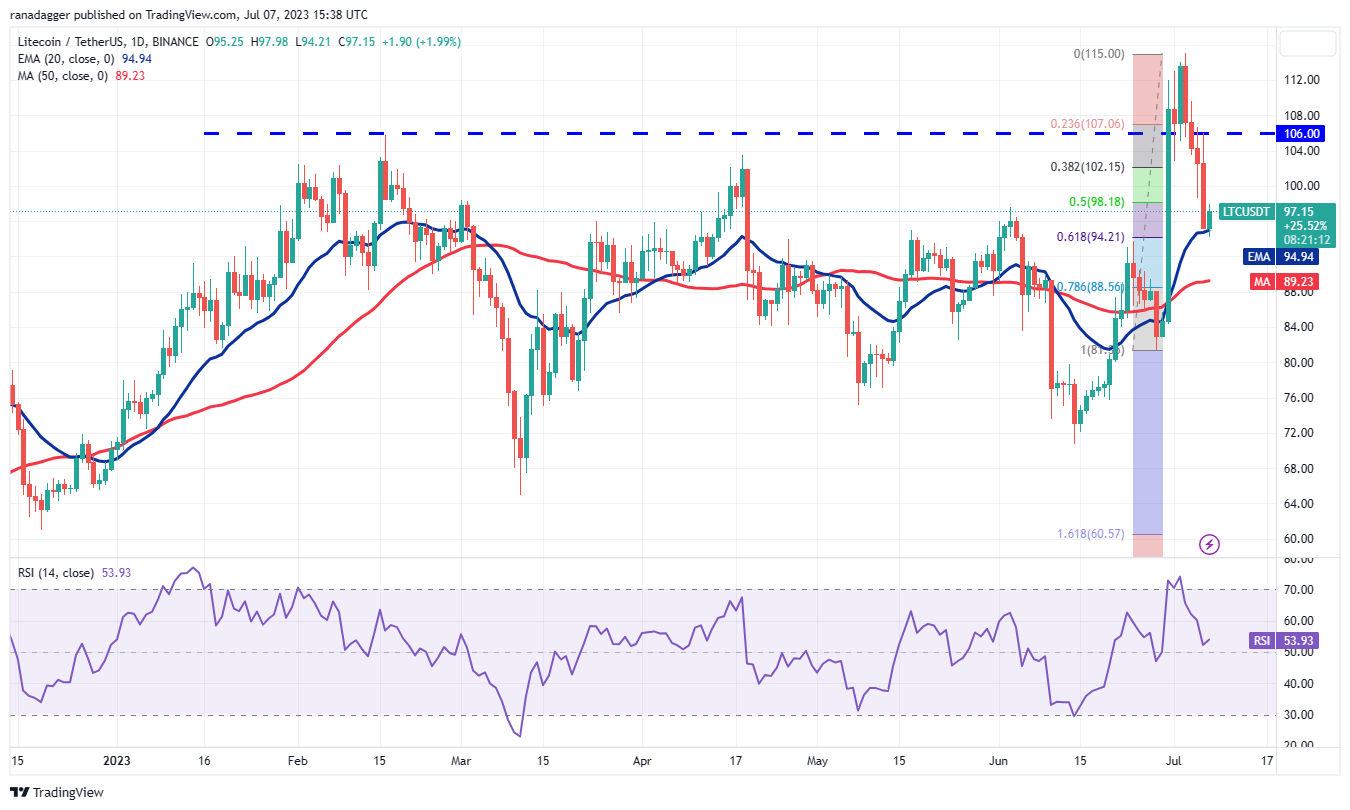
However, the bears are likely to have other plans. They will try to sell the rallies and sink the pair below the 20-day EMA. If they do that, the selling may intensify and the pair may further slide to the 50-day SMA ($89).
Polygon price analysis
Polygon (MATIC) slipped and closed below the 20-day EMA ($0.67) on July 6, suggesting that the bears are active at higher levels.
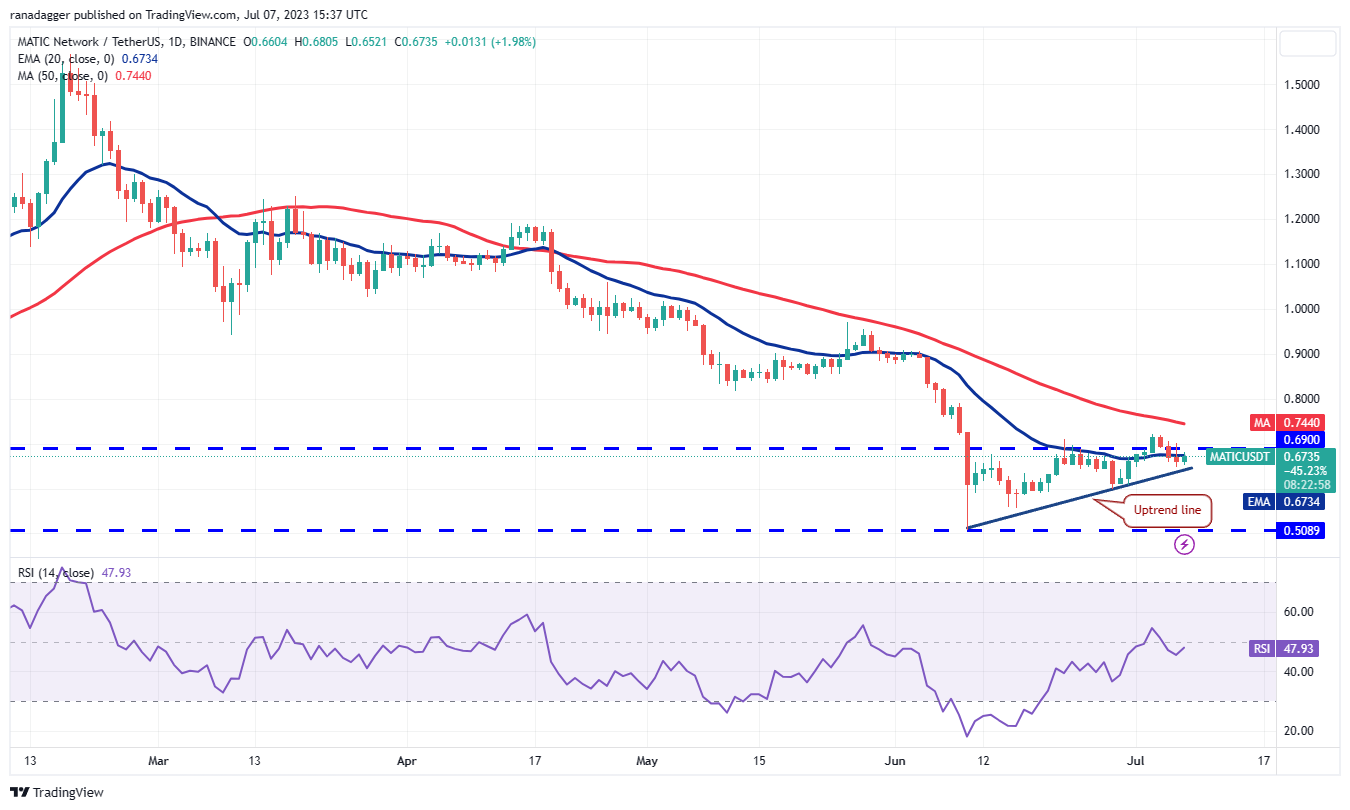
Contrary to this assumption, if the price rebounds off the uptrend line, the bulls will again try to resume the up move. A break and close above the 50-day SMA ($0.74) could start the journey toward the pattern target of $0.88.
Polkadot price analysis
The long wick on Polkadot’s (DOT) July 6 candlestick shows that the bears are selling on intraday rallies. The price plunged below the moving averages, but the bulls are trying to arrest the decline.
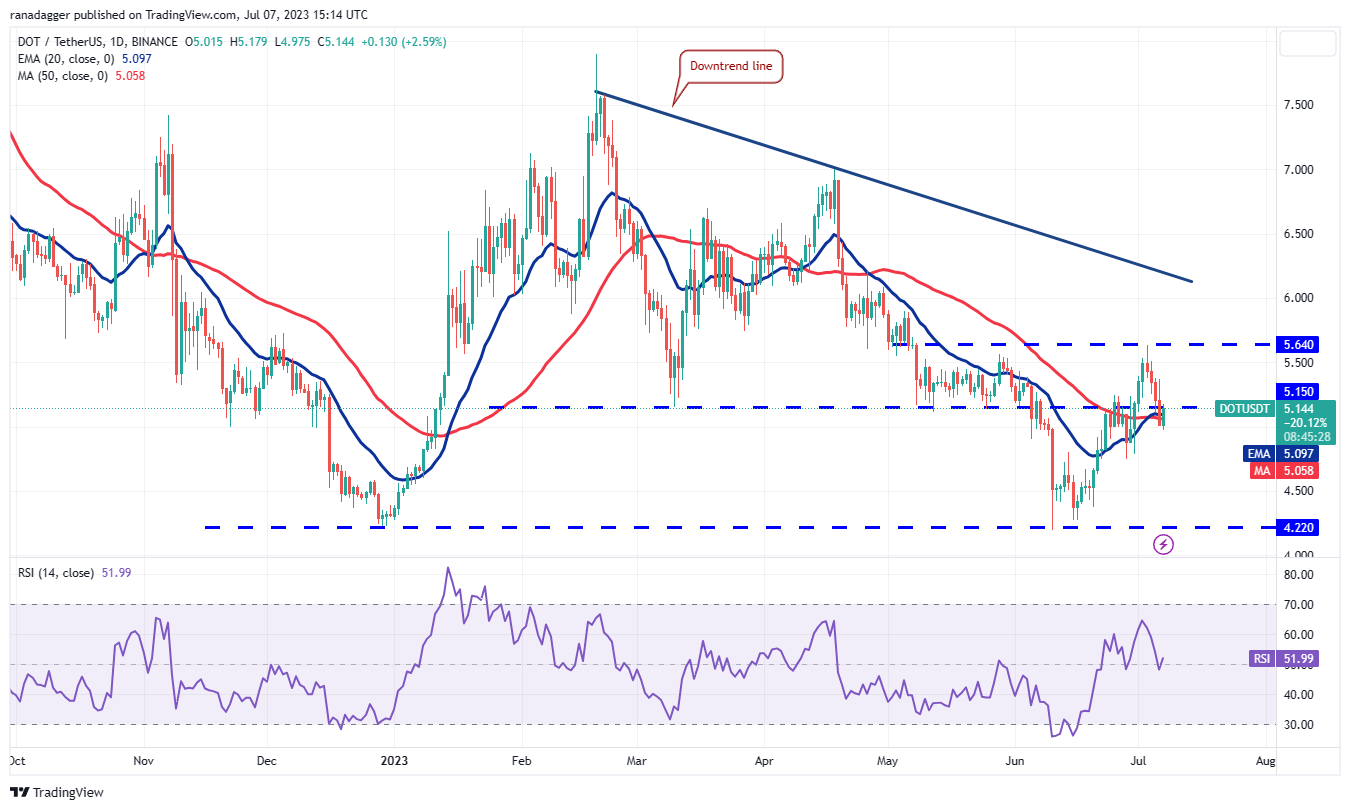
The first sign of strength will be a break and close above $5.15. That will indicate solid demand at lower levels. The bulls will then again try to push the pair to $5.64. On the downside, a break below $4.74 could tilt the advantage in favor of the bears.
This article does not contain investment advice or recommendations. Every investment and trading move involves risk, and readers should conduct their own research when making a decision.
This article is for general information purposes and is not intended to be and should not be taken as legal or investment advice. The views, thoughts, and opinions expressed here are the author’s alone and do not necessarily reflect or represent the views and opinions of Cointelegraph.



Leave A Comment