
Bitcoin (BTC) has been witnessing a tough battle between the bulls and the bears near the $25,000 level. A clear winner may not emerge in the short term due to a lack of a catalyst and because there is no major macro economic data scheduled for this week in the United States. Data points from Asia or Europe may increase volatility, but they are unlikely to start a new directional move.
Anthony Scaramucci, founder and managing partner of Skybridge Capital, in an interview with CNBC, advised investors to ride out the current uncertainty in cryptocurrencies and “stay patient and stay long term.” He expects Bitcoin to reward investors immensely with a sharp uptrend over the next six years.
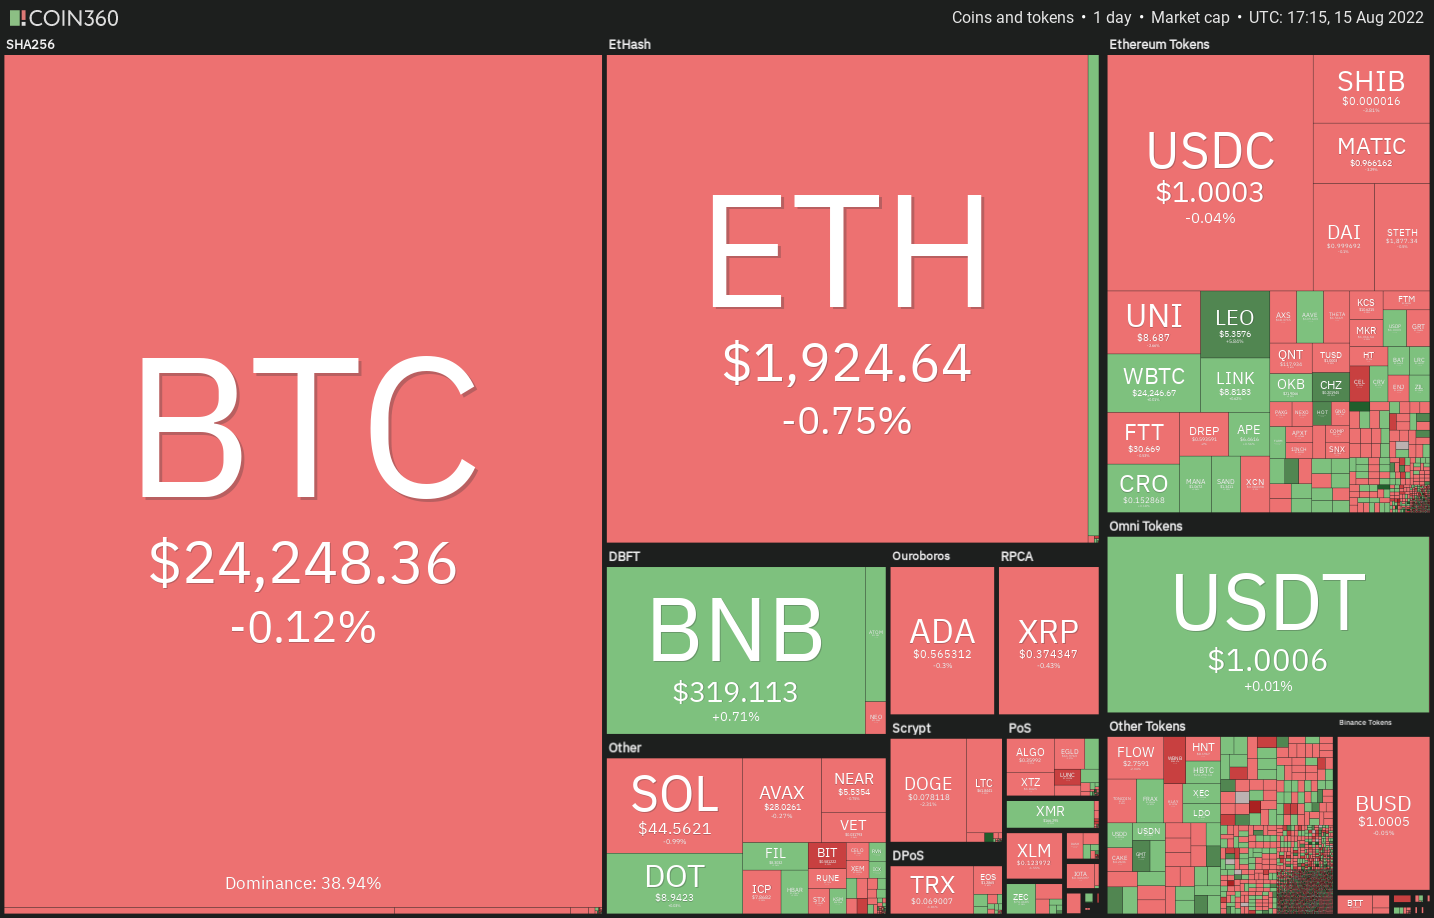
Could buying emerge at lower levels and resume the up-move in Bitcoin and the altcoins? Let’s study the charts of the top-10 cryptocurrencies to find out.
BTC/USDT
The bulls tried to resume the up-move in Bitcoin but the bears sold aggressively at $25,211 and pulled the price down to the 20-day exponential moving average ($23,483). This resulted in the formation of an outside-day candlestick pattern on Aug. 15.
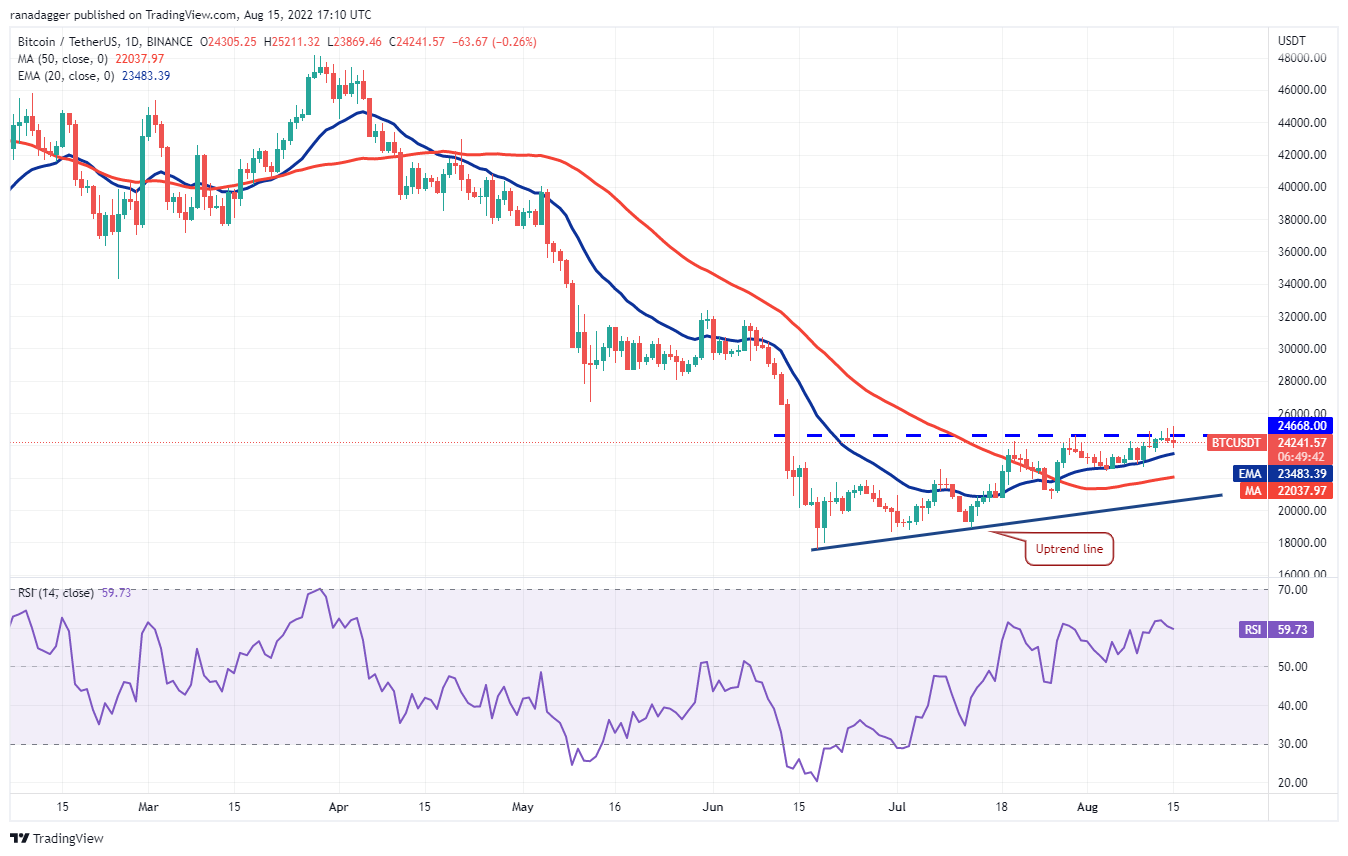
If that happens, the pair could start its northward march toward $28,000 where the bears may again pose a strong challenge.
Another possibility is that the bears sink the price below the 20-day EMA. If that happens, the pair could drop to the 50-day simple moving average ($22,037) and later to the uptrend line.
ETH/USDT
Ether repeatedly rose above the psychological resistance at $2,000 for the past two days but the bulls could not sustain the higher levels. This suggests that bears are posing a stiff challenge at this level.
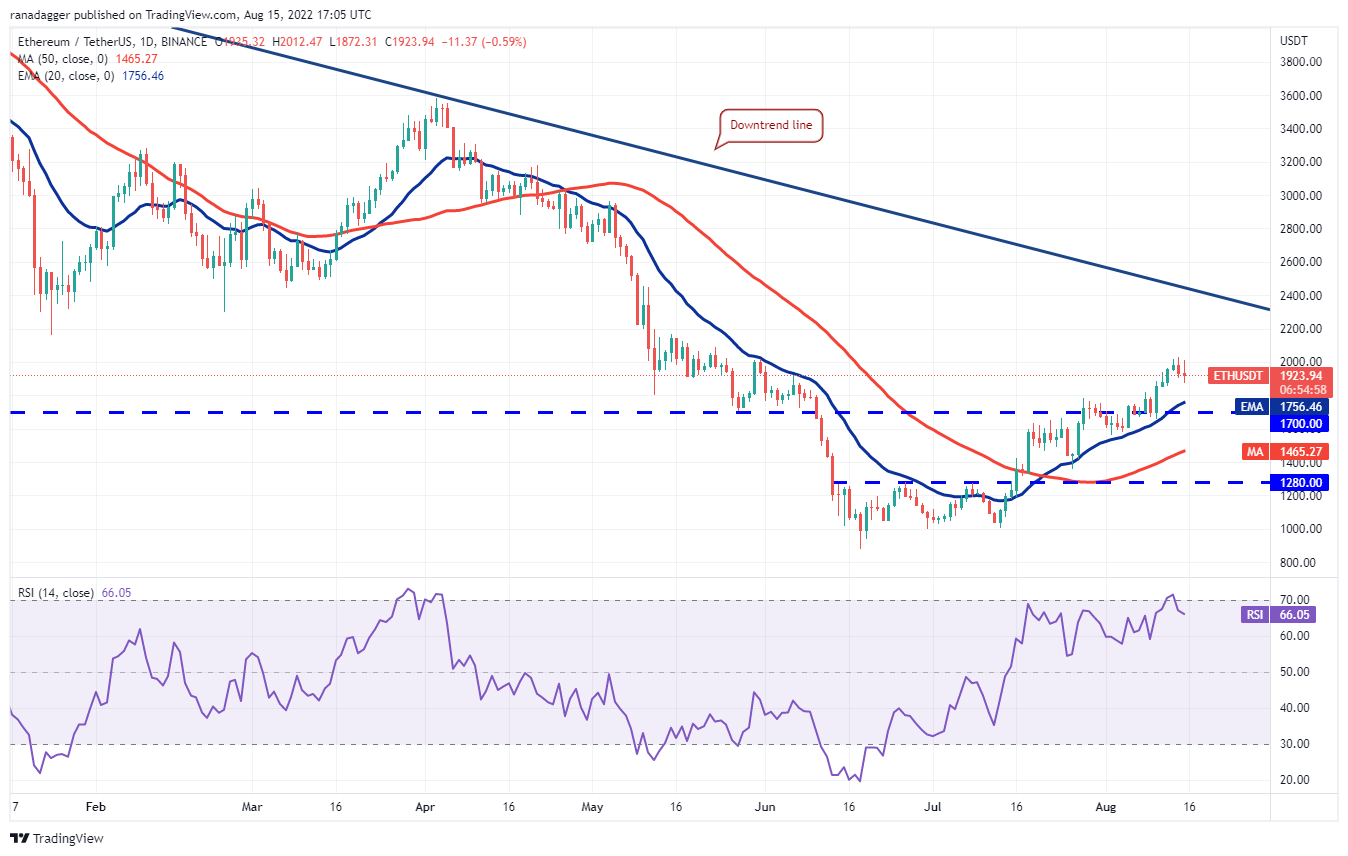
The upsloping 20-day EMA ($1,756) and the RSI in the positive territory indicate that bulls are in control. To invalidate this bullish view, bears will have to sink and sustain the price below the 20-day EMA. That could sink the pair to the 50-day SMA ($1,465).
BNB/USDT
Binance Coin’s (BNB) up-move hit a hurdle at the overhead resistance at $338. The bears will now try to sink the price to the immediate support at the 20-day EMA ($306).
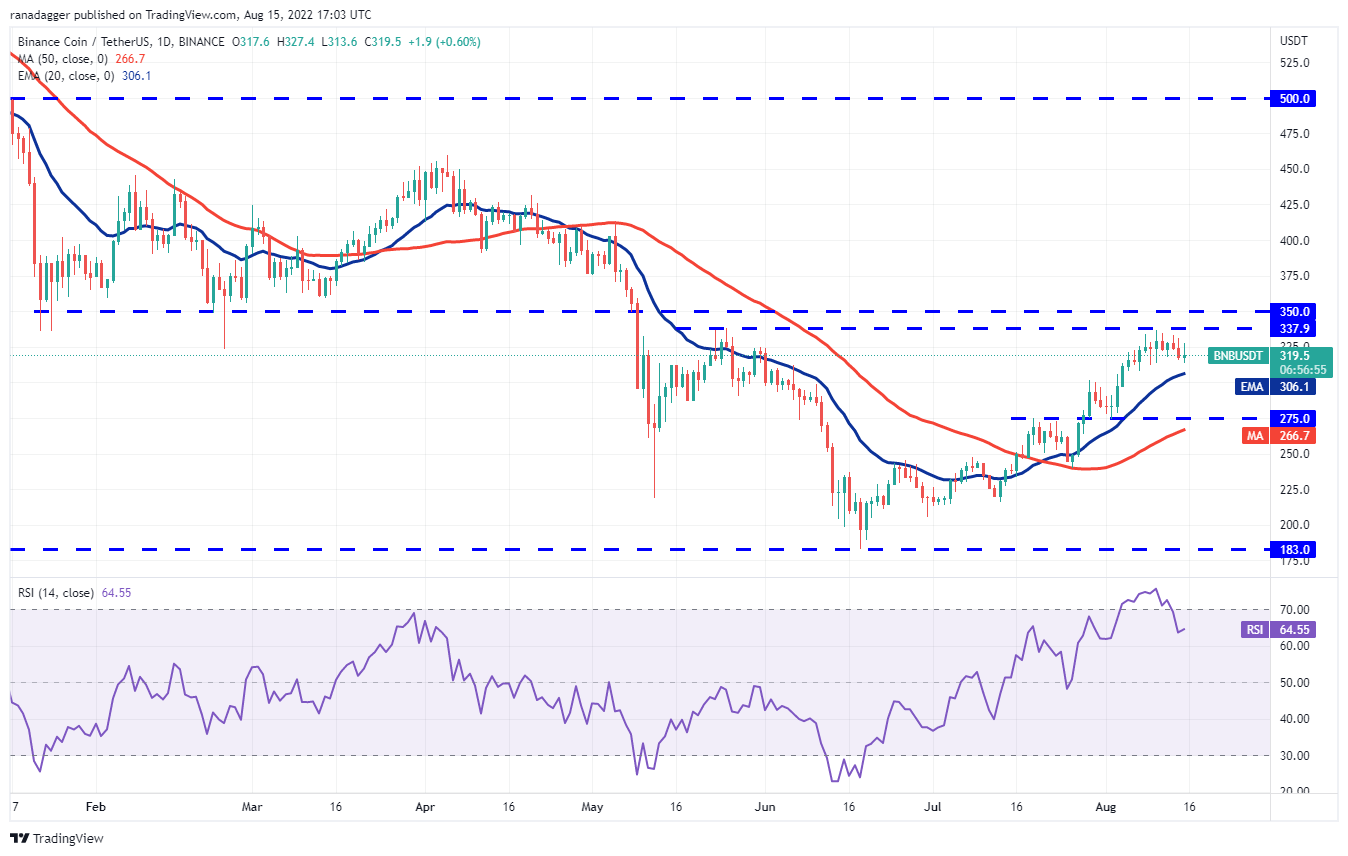
This positive view could invalidate in the near term if the price turns down and breaks below the 20-day EMA. If that happens, the short-term traders may rush to the exit and that could pull the pair to the 50-day SMA ($266).
XRP/USDT
The bulls tried to push XRP above the overhead resistance at $0.39 on Aug. 13 and Aug. 14 but the bears held their ground. This may have attracted profit-booking from the short-term traders which pulled the price below the 20-day EMA ($0.37).
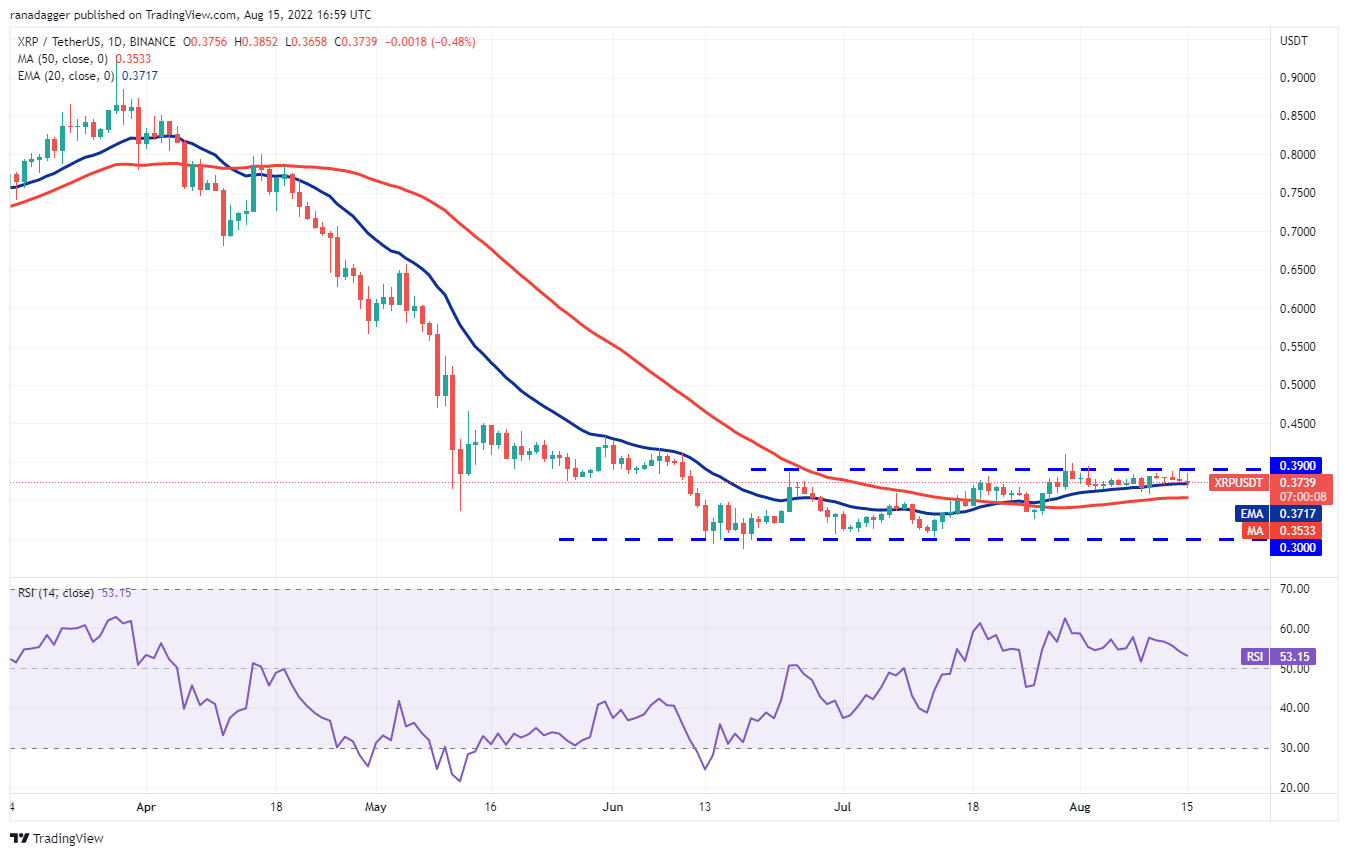
Conversely, if the price rebounds off the moving averages, it will indicate that lower levels are attracting buyers. The bulls will then again try to clear the overhead hurdle and push the pair to $0.48 and later to $0.54.
ADA/USDT
The bulls pushed Cardano (ADA) above the overhead resistance at $0.55 on Aug. 13 but could not maintain the momentum on Aug. 14. This suggests that bears are active at higher levels.
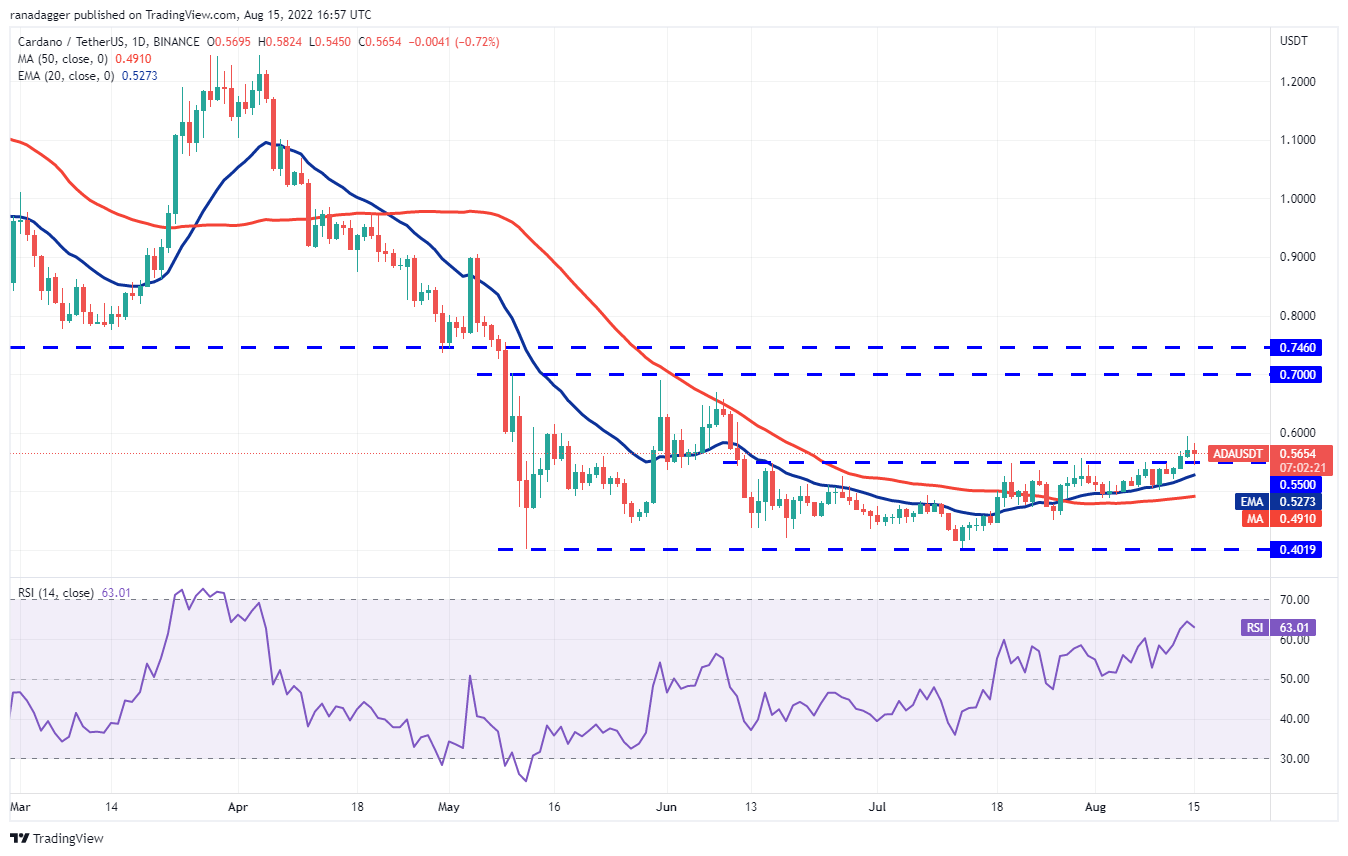
On the contrary, if the price turns down and breaks below the 20-day EMA, it will suggest that the break above $0.55 may have been a bull trap. The pair could then drop to the 50-day SMA ($0.49).
SOL/USDT
Solana (SOL) rose to the overhead resistance at $48 on Aug. 13 but the bulls could not overcome this barrier. The bulls again tried to clear the overhead hurdle on Aug. 15 but the bears did not relent.
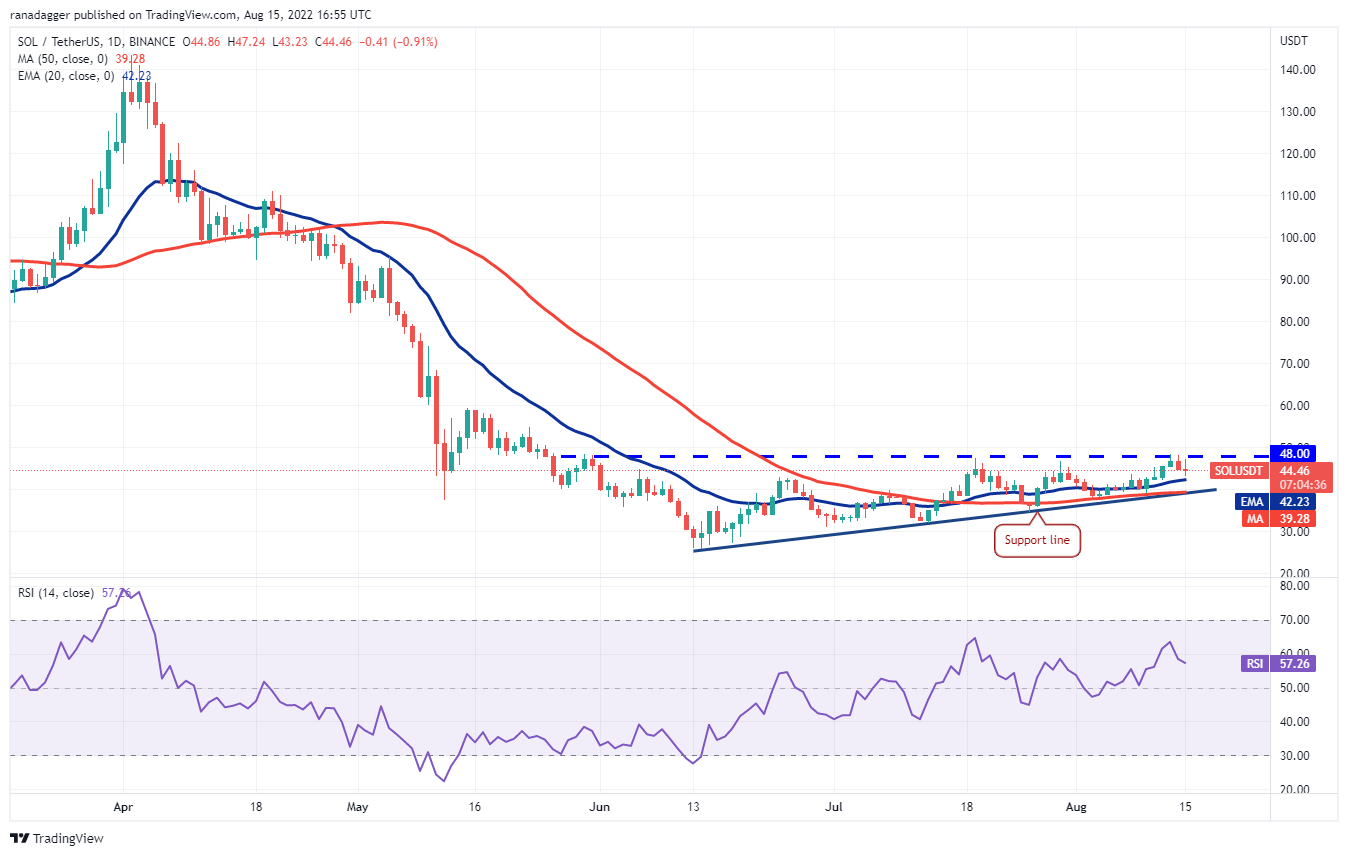
Conversely, if the price rebounds off the 20-day EMA, the bulls will again try to push and sustain the pair above $48. If they manage to do that, the bullish setup will complete and the pair could rally to $60.
DOGE/USDT
Dogecoin (DOGE) bounced off the 20-day EMA ($0.07) on Aug. 12 and broke above the overhead resistance at $0.08 on Aug. 14. This completed the bullish ascending triangle pattern but the bulls could not sustain the breakout.
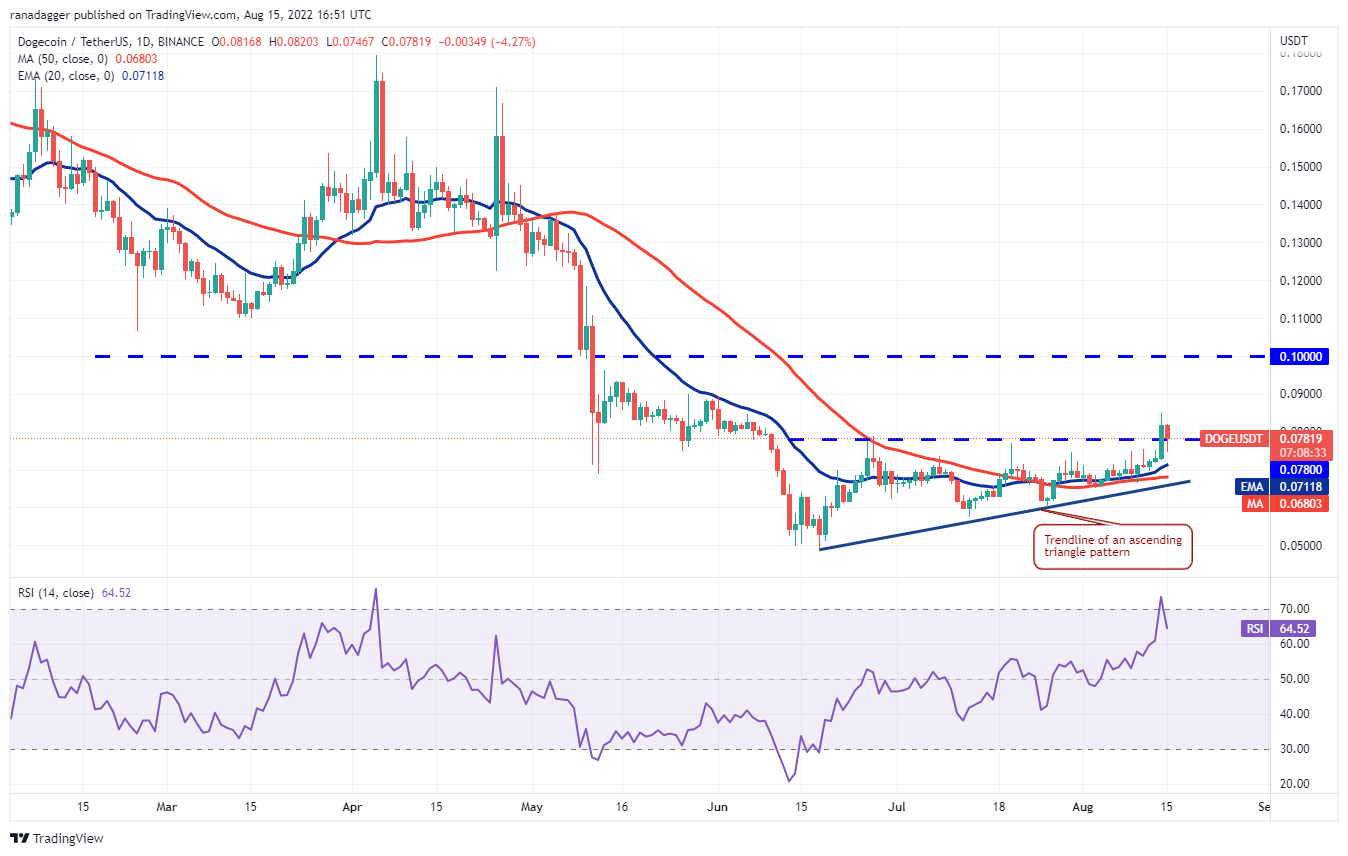
Contrary to this assumption, if the price slips below the moving averages and the trendline of the triangle, it will invalidate the bullish setup. The pair could then sink to $0.06.
Related: Crypto-focused venture firm Dragonfly acquires hedge fund: Bloomberg
DOT/USDT
Polkadot (DOT) rose above the overhead resistance of $9.65 on Aug. 13 but the bulls could not sustain the higher levels. This may have tempted the short-term traders to book profits.
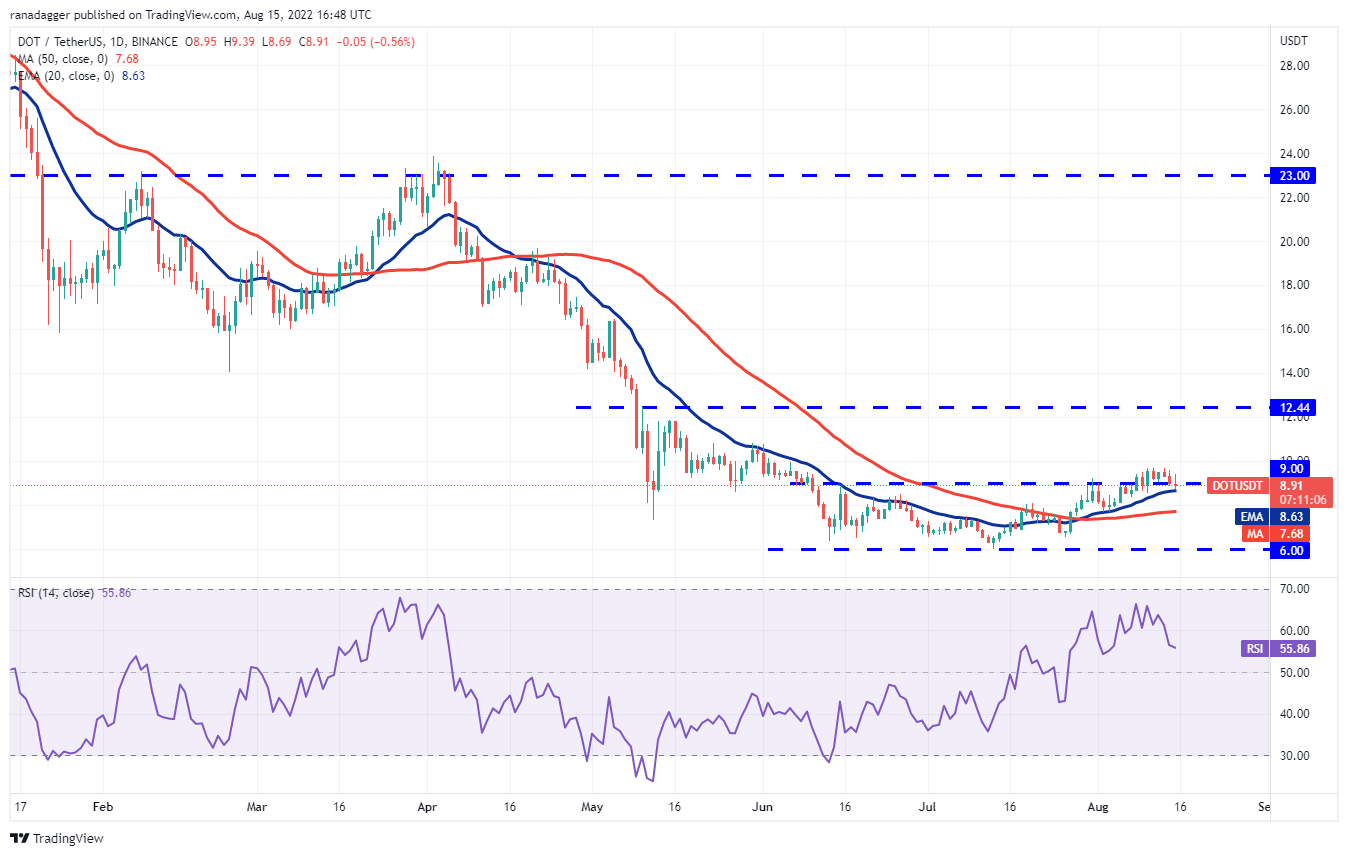
Alternatively, if the price rebounds off the 20-day EMA, the bulls will try to clear the overhead resistance at $9.68. If they pull it off, the pair could rise to $10.80 and later to $12.44.
SHIB/USDT
Shiba Inu (SHIB) had been trading above $0.000012 since Aug. 7 but the up-move had failed to pick up momentum. That changed with the sharp rally on Aug. 14, which pushed the price above the overhead resistance at $0.000017.

On the contrary, if the price breaks below $0.000014, it will indicate that the pair could oscillate in a large range between $0.000010 and $0.000018 for a few more days.
AVAX/USDT
Buyers tried to push Avalanche (AVAX) above the overhead resistance on Aug. 13 but the bears stalled the attempt at $30.35. This suggests that bears are active at higher levels.
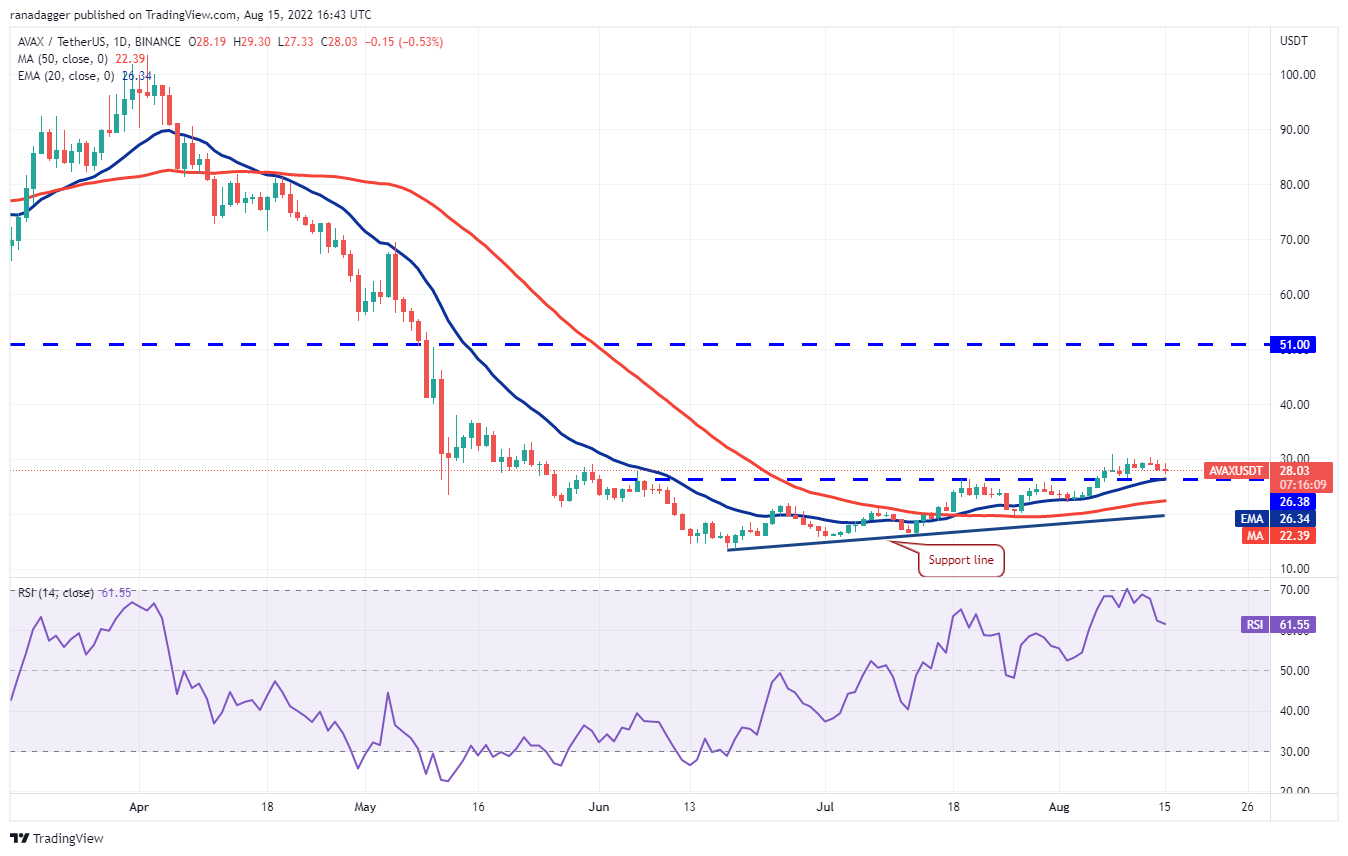
If bears sink the price below $26.38, several aggressive bulls may get trapped. That could sink the pair to the 50-day SMA ($22.39).
Conversely, if the price rebounds off the current level and rises above $31, it will suggest the start of a rally to $33 and later to the pattern target of $39.05.
The views and opinions expressed here are solely those of the author and do not necessarily reflect the views of Cointelegraph. Every investment and trading move involves risk. You should conduct your own research when making a decision.
Market data is provided by HitBTC exchange.

Related Posts
 Winnebago Industries, Inc. Q2 Profit & Revenue Blow Away Expectations
 A gaming DAO metaverse and yield farm come together in this recently launched NFT collection
 Crypto investors backed by Coinbase sue U.S. Department of Treasury after Tornado Cash sanctions
 Polkadot Web3 wallet Talisman closes $2.35M seed funding round
 There Will Be No Economic Boom
 May 2017 Producer Price Final Demand Year-Over-Year Inflation Moderates To 2.4%
Leave A Comment