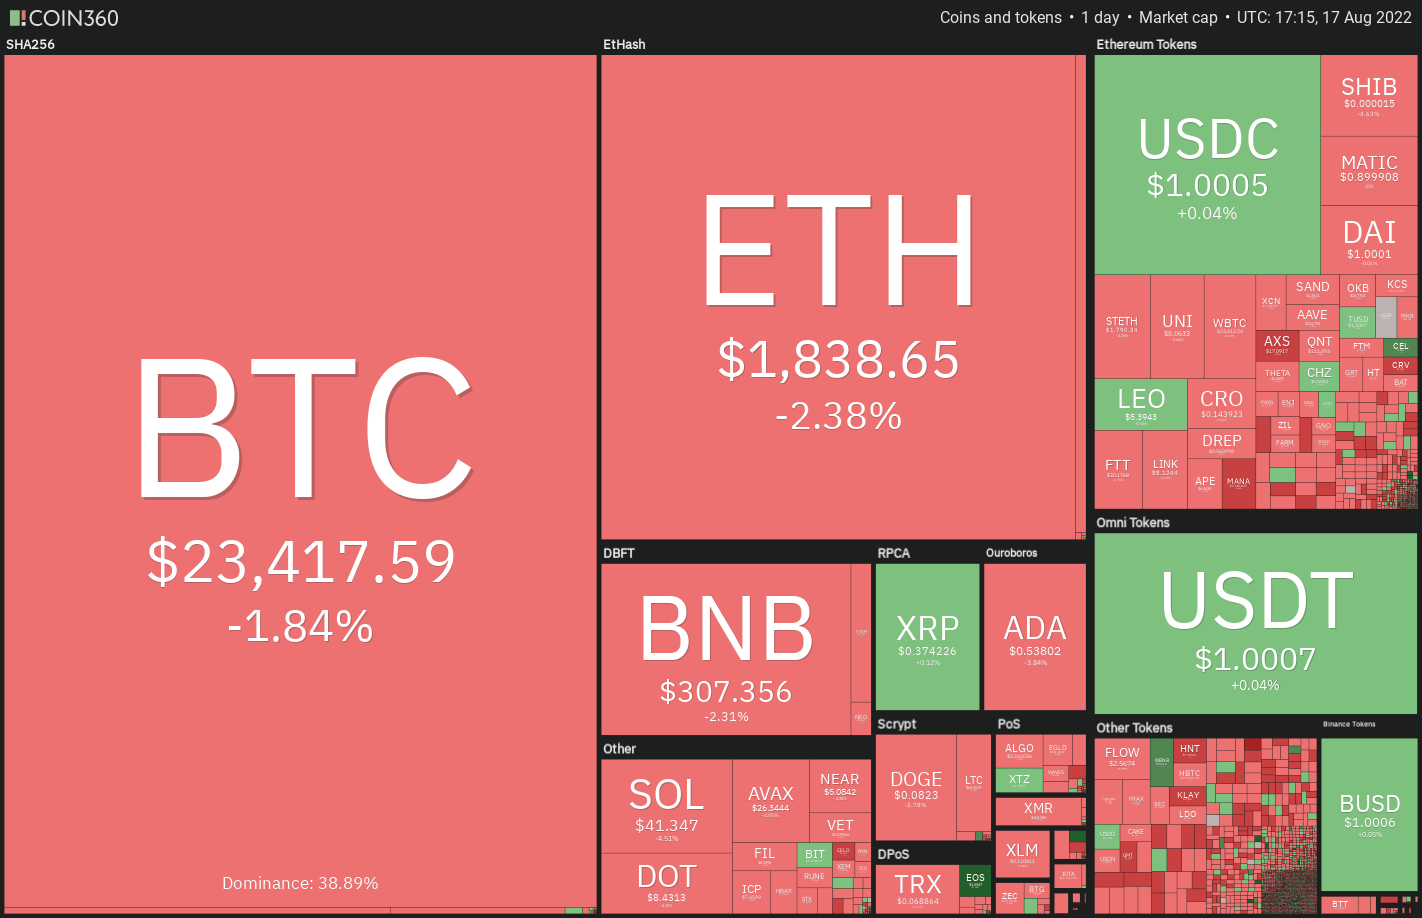
Bitcoin’s (BTC) bounce fizzled out near $24,500 on Aug. 17, indicating that the recovery still faces stiff resistance from the bears. On-chain monitoring resource Material Indicators said the ask liquidity on the Fire Charts was similar to prior local tops.
Another reason for caution among crypto investors was that the recovery in the S&P 500 was reaching extreme overbought levels in the near term. Jurrien Timmer, director of global macro at asset manager Fidelity Investments, said that 88% of stocks in the S&P 500 were trading above their 50-day moving average, which was “stunning.”
Some were also cautious as Michael Burry, the investor who famously shorted the 2008 housing bubble, almost emptied his equity portfolio in the second quarter of this year in expectation of a sharp fall in the stock markets.

What are the critical levels on the downside that will suggest that the recovery could be faltering? Let’s study the charts of the top-10 cryptocurrencies to find out.
BTC/USDT
The bulls attempted to push Bitcoin above the overhead resistance at $24,668 on Aug. 17 but the long wick on the candlestick shows that bears are defending the level aggressively. The price turned down and has reached the 20-day exponential moving average ($23,496). This level is likely to attract strong buying by the bulls.

Conversely, if the price rebounds off the current level and breaks above $25,200, it will suggest that bulls are back in command. The BTC/USDT pair could then rally to $28,000 where the bears may again mount a strong defense.
ETH/USDT
Ether (ETH) turned up from $1,853 on Aug. 16 and the bulls tried to push the price above $2,000 on Aug. 17. However, the long wick on the day’s candlestick suggests that traders may be lightening positions on rallies.

If the price rebounds off this support zone, the ETH/USDT pair could retest the resistance at $2,030. A break and close above this level could clear the path for a rally to the downtrend line.
Instead, if the $1,700 support cracks, the pair could drop to the 50-day SMA ($1,492). That could delay the start of the next leg of the up-move and keep the pair range-bound for a few days.
BNB/USDT
The buyers tried to push Binance Coin (BNB) higher on Aug. 17 but the long wick on the candlestick suggests that bears are active at higher levels. That pulled the price to the 20-day EMA ($307).

Another possibility is that the price rebounds off the current level with strength. If that happens, it will suggest that the sentiment remains positive and traders are buying on dips. The bulls will then again attempt to clear the overhead resistance zone between $338 and $350. If they succeed, the pair could start a rally to $383 and then to $413.
XRP/USDT
The bulls successfully defended the zone between the moving averages and tried to push XRP above the overhead resistance at $0.39 on Aug. 17. The long wick on the day’s candlestick shows that bears are not willing to surrender and they continue to defend the overhead resistance with vigor.

Alternatively, if the price rebounds off the moving averages, the bulls will again try to clear the overhead hurdle at $0.39. If they succeed, the pair could rally to $0.48 and then to $0.54.
ADA/USDT
Cardano (ADA) bounced off the breakout level of $0.55 on Aug. 16 but the bears continue to pose a strong challenge at higher levels as seen from the long wick on the Aug. 17 candlestick.

Conversely, if the price rebounds off the 20-day EMA, it will suggest strong demand at lower levels. The bulls will then try to resume the up-move by pushing the pair above $0.60. That could open the doors for a possible rally to $0.63 and then to $0.70.
SOL/USDT
Solana (SOL) attempted a rebound off the 20-day EMA ($42) but the long wick on the Aug. 17 candlestick shows that the bears are selling on every minor rise.

Alternatively, if the price rebounds off the moving averages, it will indicate that bulls may be accumulating on dips. The buyers will then try to push the price above the overhead resistance at $48. If they succeed, the bullish setup will complete and the pair may start a rally to $60.
DOGE/USDT
The bears pulled Dogecoin (DOGE) below the breakout level of $0.08 on Aug. 15 but could not sustain the lower levels. The bulls purchased the dip aggressively and resumed the recovery on Aug. 16.

The 20-day EMA ($0.07) has started to turn up and the RSI is in the positive territory, indicating that bulls have the upper hand. To invalidate this bullish view, the bears will have to sink and sustain the price below the trendline of the triangle.
Related: Fake Manchester United token soars 3,000% after Elon Musk jokes about buying team
DOT/USDT
The bulls successfully defended the 20-day EMA ($8.62) on Aug. 15 and 16 but could not achieve a strong rebound off it. Attempts by the bulls to push Polkadot (DOT) above the overhead resistance at $9 met with stiff resistance on Aug. 17.

Conversely, if the price turns up from the current level and rises above $9, it will suggest that bulls are aggressively buying at lower levels. The bulls will then attempt to push the pair above the overhead resistance at $9.68 and resume the recovery. The pair could then rally to $10.80 and later to $12.44.
SHIB/USDT
Shiba Inu’s (SHIB) correction stalled at $0.000015 on Aug. 15 but the bulls are facing stiff resistance at the overhead resistance of $0.000017 as seen from the long wick on the Aug. 16 and 17 candlesticks.

The SHIB/USDT pair could then remain stuck inside a large range between $0.000010 and $0.000018 for a few days.
Alternatively, if the price turns up from the current level and rises above the $0.000017 to $0.000018 overhead resistance zone, the pair could rise to $0.000022. If bulls clear this hurdle, the rally could extend to $0.000026.
AVAX/USDT
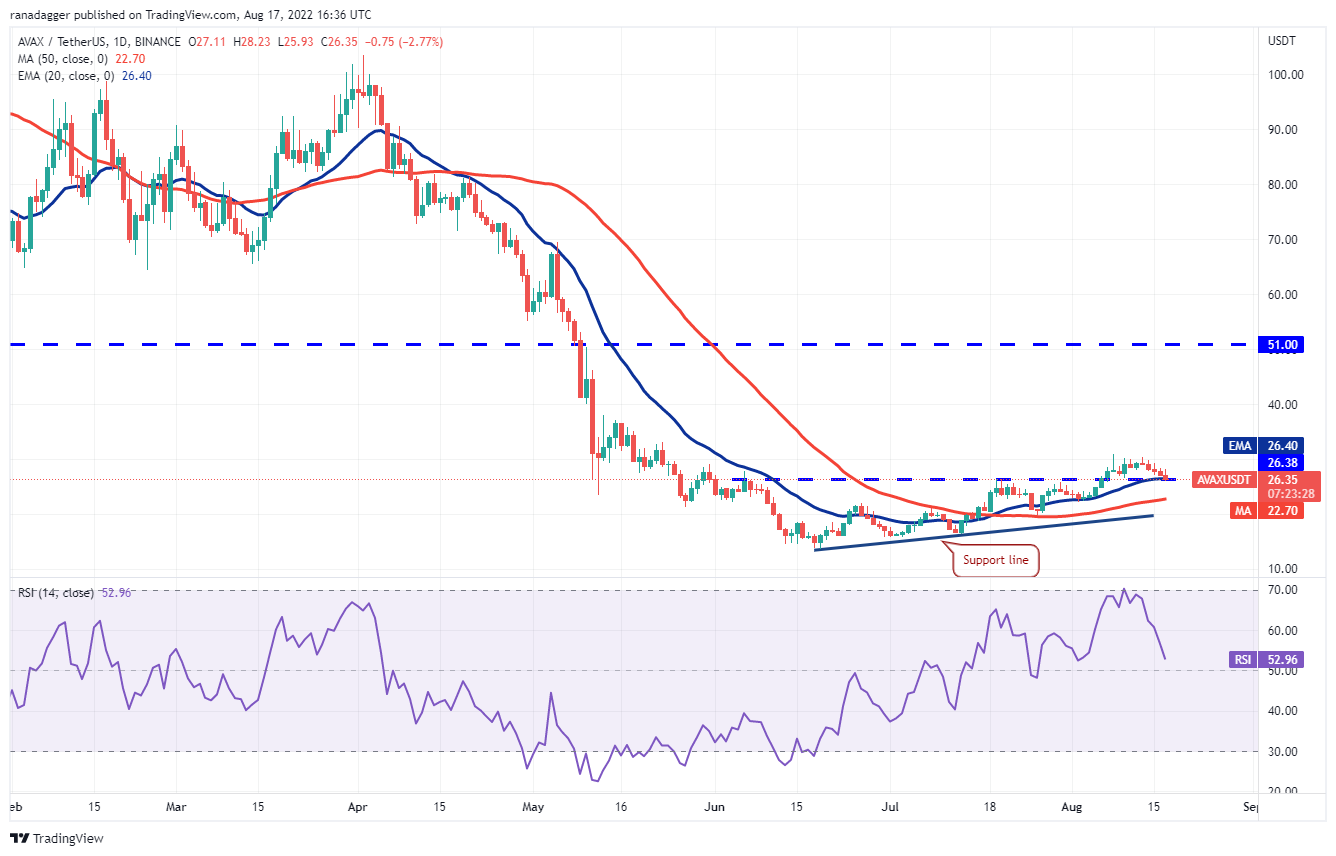
Avalanche (AVAX) continues to slide toward the breakout level of $26.38. The bulls are likely to buy the dip and attempt to flip this level into support.

Contrary to this assumption, if the price breaks below the breakout level, several aggressive bulls may get trapped. That could result in a decline to the 50-day SMA ($22.70) and then to the support line of the ascending triangle.
The views and opinions expressed here are solely those of the author and do not necessarily reflect the views of Cointelegraph. Every investment and trading move involves risk. You should conduct your own research when making a decision.
Market data is provided by HitBTC exchange.


Leave A Comment