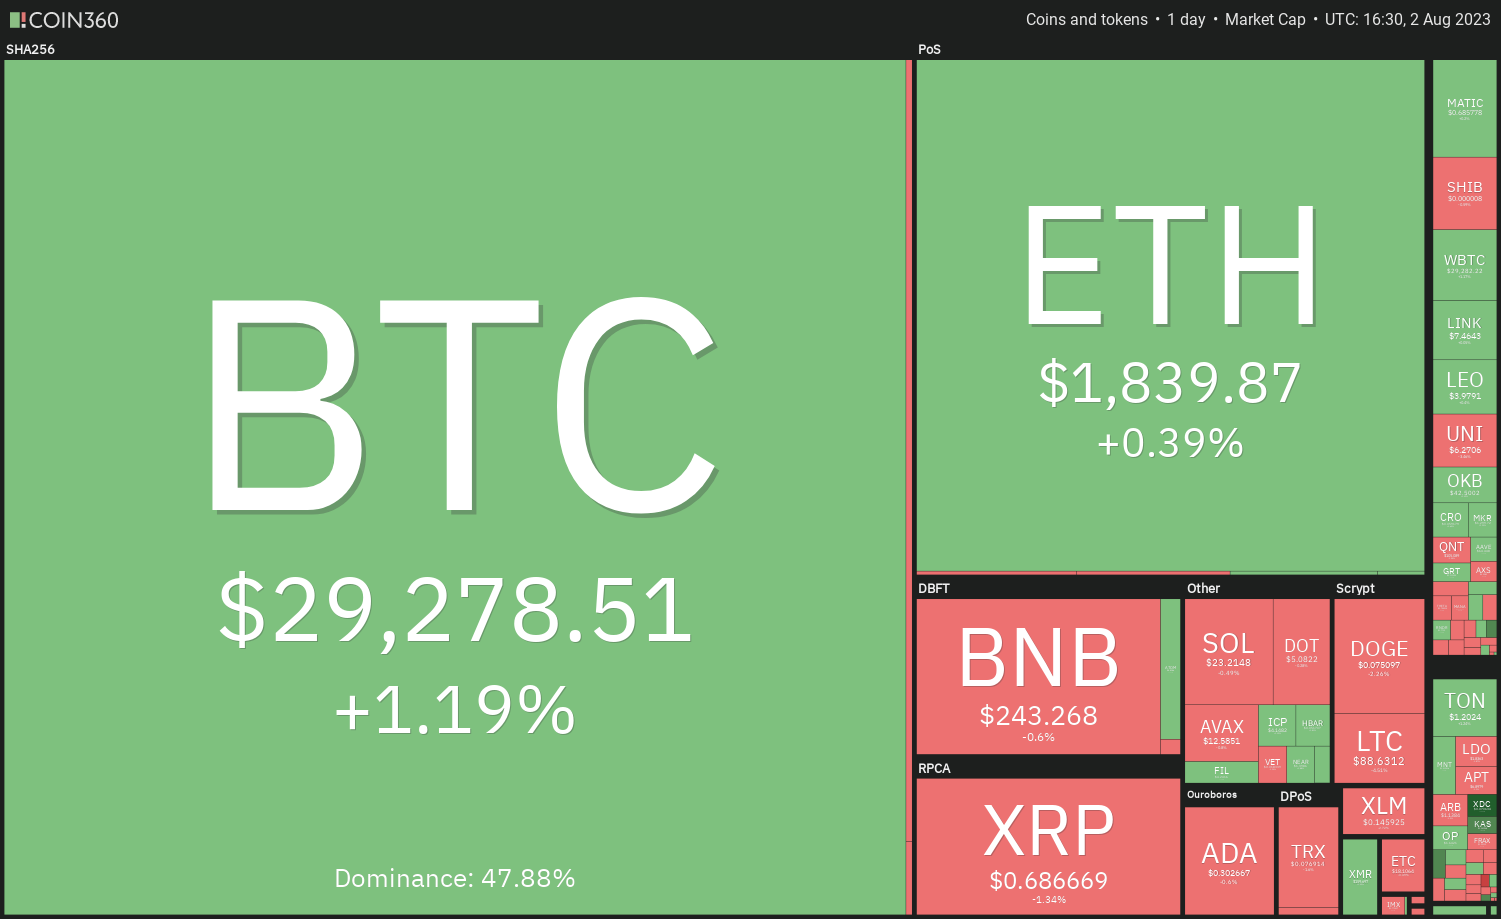
Ratings agency Fitch downgraded the United States’ long-term credit rating from AAA to AA+ on Aug. 1 and this move dented the risk on sentiment. The U.S. equities markets witnessed profit-booking on Aug. 2 and the cryptocurrency market’s recovery stalled in its tracks.
However, after the knee-jerk reaction, the markets may settle down. The cryptocurrency markets are likely to keep their focus on the news and events surrounding the Bitcoin (BTC) spot exchange-traded fund (ETF) applications. Bloomberg ETF analysts Eric Balchunas and James Seyffart said in a statement that the possibility of an ETF application getting greenlighted has surged from 1% a couple of months ago to 65%.

Will buyers defend the immediate support levels in Bitcoin and altcoins or could the bears overpower the bulls? Let’s study the charts of the top-10 cryptocurrencies to find out.
Bitcoin price analysis
Bitcoin’s volatility picked up on Aug. 1. The bears pulled the price below the immediate support at $28,861 but the long tail on the candlestick shows aggressive buying at lower levels.

The 20-day EMA is flattening out and the relative strength index (RSI) is just below the midpoint, indicating a range formation in the near term. The boundaries of the range could be $30,050 on the upside and $28,585 on the downside.
If buyers drive the price above this narrow range, the BTC/USDT pair could rise to the overhead resistance zone between $31,000 and $32,400. On the downside, a crack below $28,585 may start a downward move to $27,500 and then to $26,000.
Ether price analysis
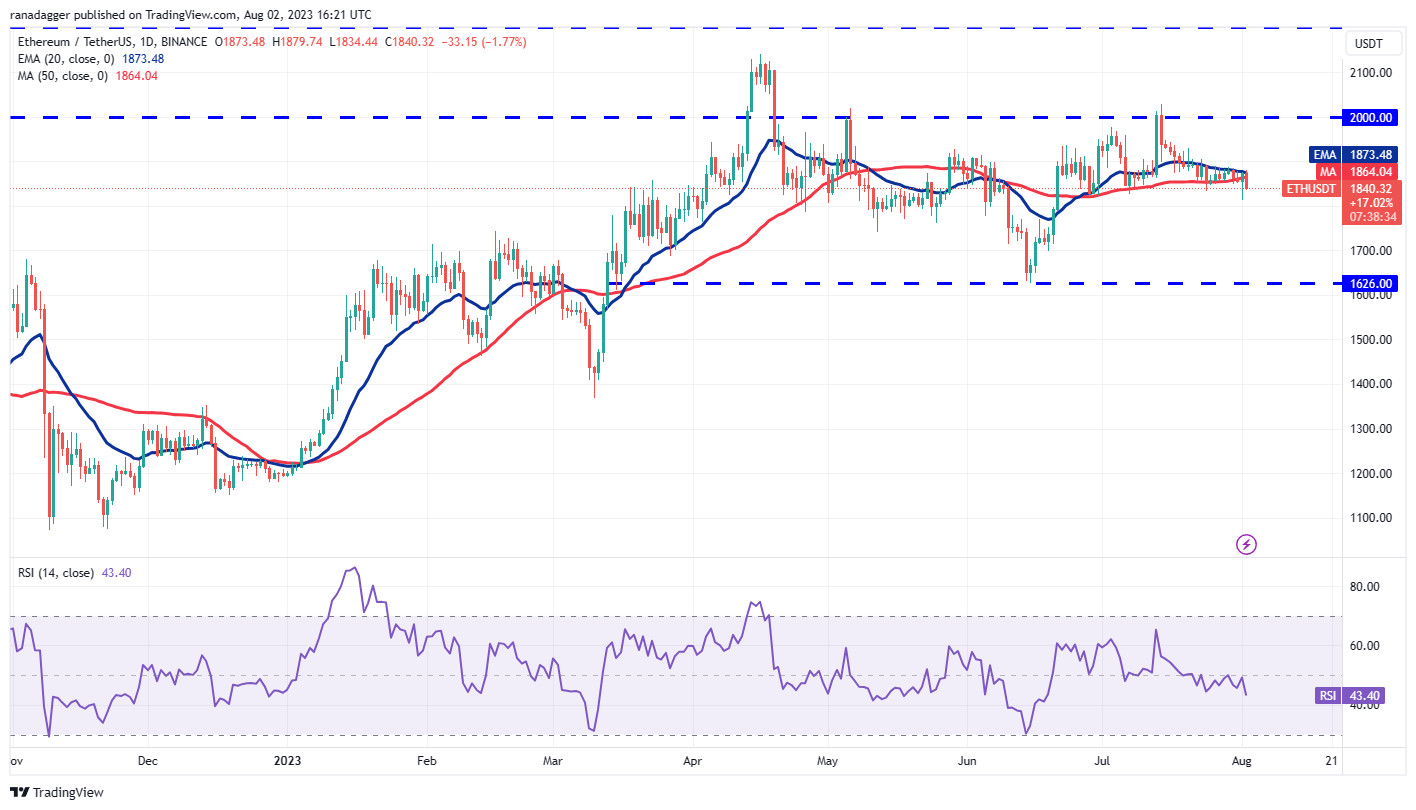
The tight-range trading in Ether (ETH) resolved to the downside on Aug. 1 but the bears could not sustain the lower levels as seen from the long tail on the day’s candlestick.

If they manage to do that, the ETH/USDT pair could drop to $1,813. A break and close below this level could sink the pair to $1,700 and then $1,626.
If bulls want to prevent the short-term decline, they will have to overcome the hurdle at the 20-day EMA. That could start an up-move to the psychological resistance at $2,000.
BNB price analysis
BNB’s (BNB) volatility picked up on Aug. 1 but the bulls could not push the price above the resistance line of the triangle.

On the contrary, if the price skids below the moving averages, the pair could drop to the support line of the triangle. If this support crumbles, the pair may retest the vital support at $220.
XRP price analysis
XRP (XRP) rebounded off the support at $0.67 on Aug. 1 but the bulls could not sustain the higher levels. This suggests that the bears are selling on every minor relief rally.

Alternatively, if the price once again rebounds off $0.67 with strength, it will indicate that the bulls are fiercely defending the level. That could push the price to the immediate resistance at $0.75. A break above this level could open the doors for a possible rally to $0.85.
Dogecoin price analysis
Dogecoin (DOGE) snapped back from the 20-day EMA ($0.07) on Aug. 1 indicating that lower levels are attracting buyers.

Instead, if the price once again rebounds off the 20-day EMA, it will signal that the sentiment remains positive and the bulls are buying the dips. That could enhance the prospects of a break above the overhead resistance. The pair may then rise to $0.10.
Cardano price analysis
The bears pulled Cardano (ADA) below the immediate support at $0.30 on Aug. 1 but the bulls bought the dip to the 50-day SMA ($0.29).

Contrary to this assumption, if the price continues lower and breaks below the 50-day SMA, it will suggest that the bears have seized control. The pair could then slide to $0.26 and eventually to $0.24.
Solana price analysis
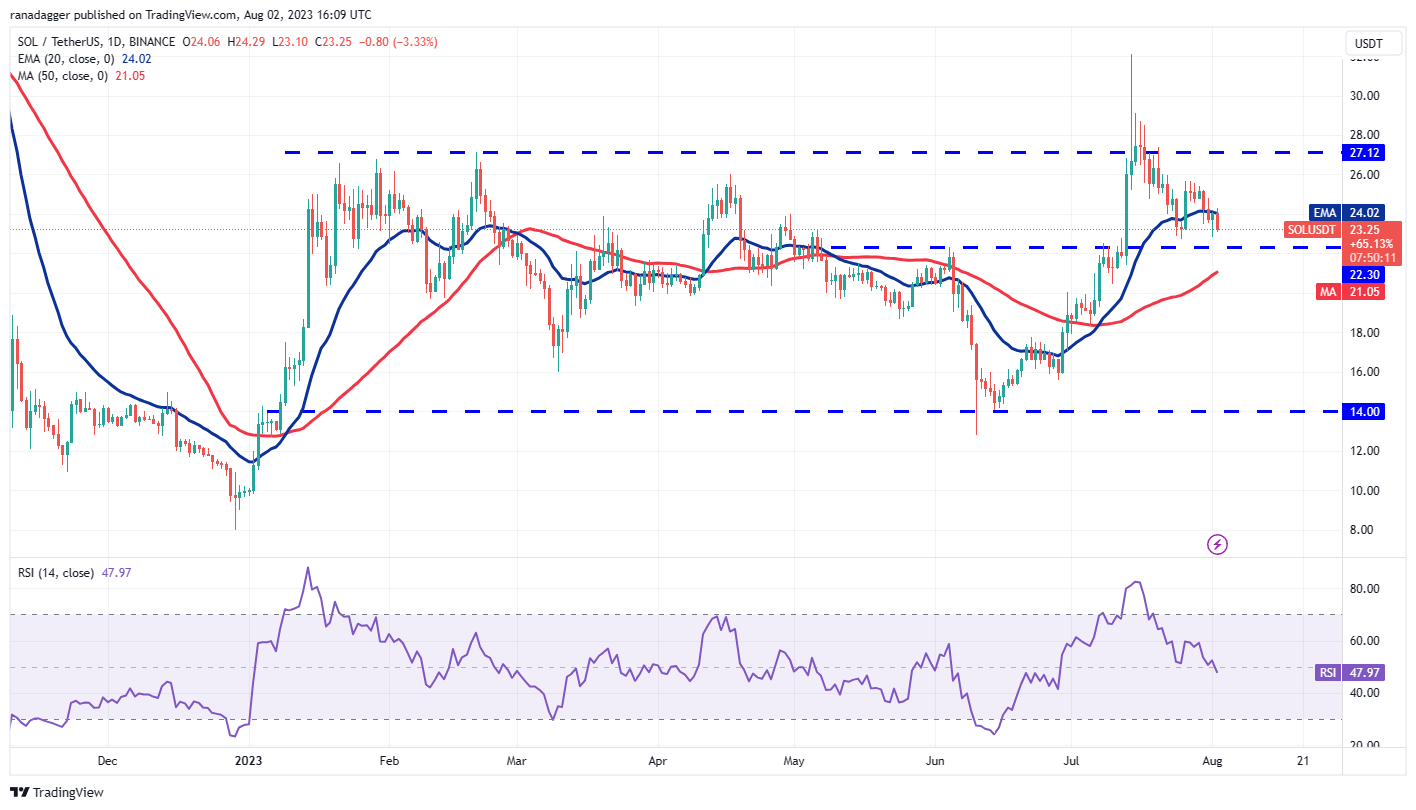
Solana (SOL) snapped back from the strong support at $22.30 on Aug. 1 but the bulls could not push and sustain the price above the 20-day EMA ($24.02).

On the other hand, if the price once again bounces off $22.30, it will indicate that the bulls are guarding this level with vigor. The pair may first recover to $25.68 and thereafter retest the crucial resistance at $27.12.
Related: Why is Bitcoin price stuck?
Polygon price analysis
Polygon (MATIC) has been gradually pulling down lower. The bears tugged the price below the 50-day SMA ($0.69) on July 31 but the bulls pushed the price back above the level on Aug. 1.

This negative view will invalidate in the near term if the price turns up from the current level and breaks above the 20-day EMA. That could open the gates for a possible rally to $0.80. This level may prove to be a stiff barrier but if bulls overcome it, the pair could reach $0.90.
Litecoin price analysis
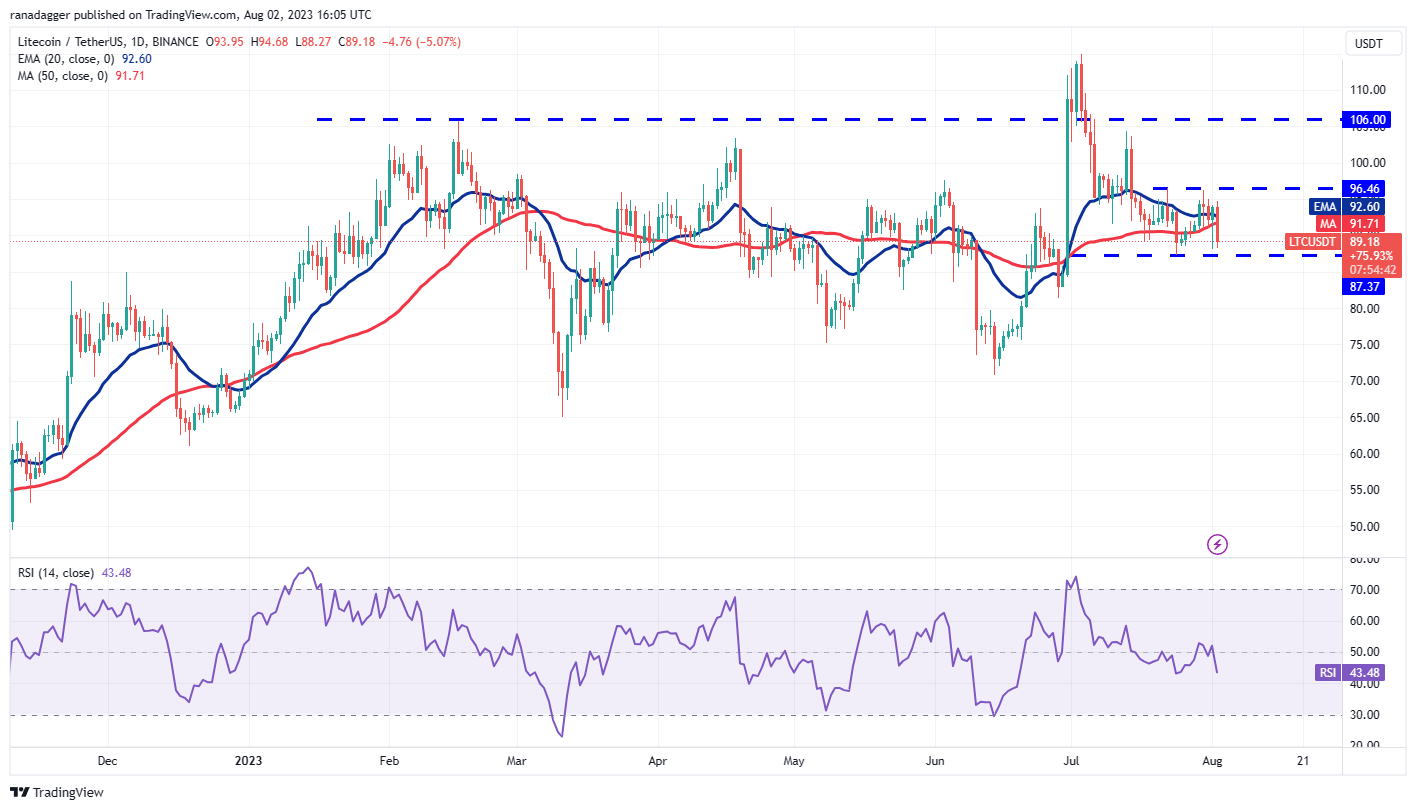
Litecoin (LTC) bounced off the strong support at $87 on Aug. 1. This shows that the price remains stuck inside the range between $97 and $87.

Contrary to this assumption, if the price turns up from $87, it will suggest that the pair may extend its stay inside the range for a few more days. The bulls will have to drive the price above $97 to start an up-move to $106.
Polkadot price analysis
The bears tried to resolve the uncertainty in Polkadot (DOT) in their favor on Aug. 1 but the bulls thwarted their attempt.

The important support to watch on the downside is the 50-day SMA. If the price sustains below this level, the selling could intensify and the DOT/USDT pair may slump to $4.74 and then to $4.65.
Contrarily, a rise above the 20-day EMA may enhance the prospects of a rally to the overhead resistance at $5.64.
This article does not contain investment advice or recommendations. Every investment and trading move involves risk, and readers should conduct their own research when making a decision.


Leave A Comment