Last week, as Bitcoin resurged after briefly falling below $30,000, a good number of altcoins embarked on their own relief rallies. Telcoin (TEL) was among this large group of digital assets whose prices shot up on July 21.
Unlike most of its peers, however, TEL’s upward trend remained alive for the entire week, leading to a respectable 82% gain against the dollar and a 43% gain against Bitcoin (BTC) over a seven-day period.
Given the market dynamics of the time, many traders may simply attribute this performance to a marketwide oversold bounce — but was there a way for traders to spot the potential for this tremendous run early?
TEL’s second wave
TEL is the utility token of Telcoin, a blockchain protocol designed to facilitate affordable mobile-based remittances globally. Telcoin is built on the Ethereum blockchain, and the token trades across a range of centralized and decentralized exchanges.
At the height of this week’s excellent performance, TEL reached the value of $0.022. This is still way below the coin’s all-time high registered in May, when a layer-two migration to QuickSwap and a protocol upgrade saw the asset multiply its value tenfold in just over a week, hitting the ceiling at $0.060.
This time around, the fuel for TEL’s moonshot likely came from a combination of favorable developments. Earlier in the month, the firm closed a $10-million fundraising round and simultaneously introduced a new Telcoin platform stack and two new user-owned decentralized finance (DeFi) products. Additionally, some observers notedsome observers noted that the protocol saw a spike in user attention resulting from the launch of the AI-driven tool “DeFI Agents” on the Fetch protocol.
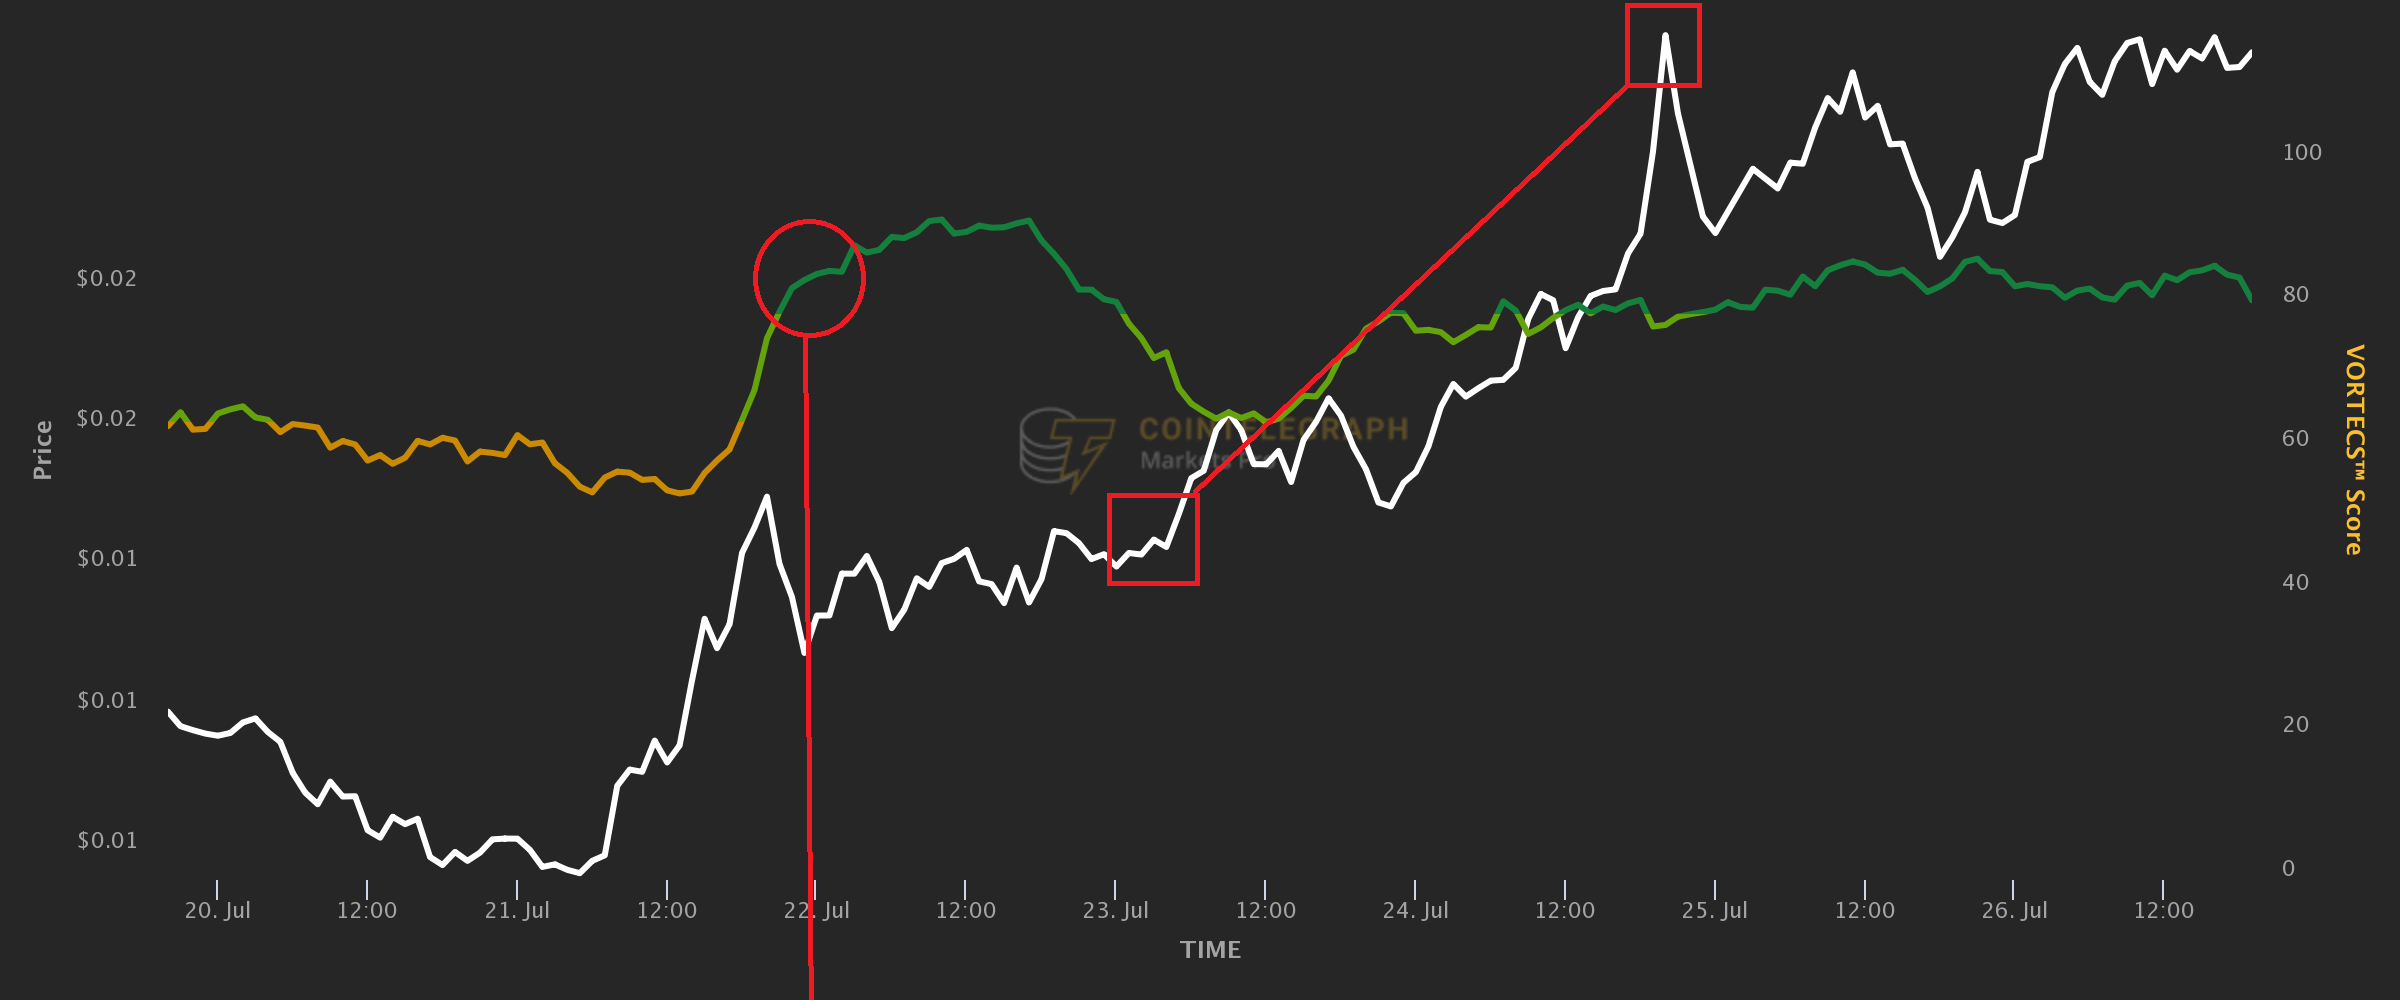
The price increase chart was not the only ranking that Telcoin topped this week. Ahead of its spectacular rally, the coin also recorded the highest VORTECS™ Score of the week at 92. This value indicated the algorithm’s ultra-high confidence that the outlook for TEL had become bullish. Traders who took heed had a chance of joining the ensuing gainsfest early.
Detecting when history rhymes
The VORTECS™ Score, exclusively available to the subscribers of Cointelegraph’s data intelligence platform Markets Pro, is a quantitative-style indicator that offers a real-time comparison of several key market metrics around each coin based on years of historical data.
Ultimately, the metric assesses whether the current outlook for this asset is bullish, bearish or neutral given the historical record of price action.

By convention, scores above 80 correspond to the model’s high confidence that in the past, patterns of market and social activity similar to those currenctly observed were consistently followed by significant price increases within 12 to 72 hours.
In the case of TEL’s score of 92, the algorithm detected that throughout the asset’s history, such rallies have tended to resume after brief periods of recoil. Indeed, some 24 hours after the VORTECS™ line went dark green, a second leg of TEL’s hike unfolded, taking the coin from $0.014 to $0.021 (the first and second red boxes).
In the cryptocurrency market, much like anywhere else, history doesn’t exactly repeat itself — but it often rhymes. When history manifests in quantifiable metrics, an industry-grade artificial intelligence tool like theVORTECS™ Score can aid traders’ decision-making by alerting them to the conditions under which a rhyme is most likely to emerge.
As for TEL, a continuing stretch of extremely high VORTECS™ Scores suggests that — the overall crypto market’s health permitting — the asset could be in for a further price hike. Judging from historical precedent, it seems that the coin has not yet exhausted its bullish momentum.
Cointelegraph is a publisher of financial information, not an investment adviser. We do not provide personalized or individualized investment advice. Cryptocurrencies are volatile investments and carry significant risk including the risk of permanent and total loss. Past performance is not indicative of future results. Figures and charts are correct at the time of writing or as otherwise specified. Live-tested strategies are not recommendations. Consult your financial advisor before making financial decisions.
Full terms and conditions.


Leave A Comment