In this article, I will continue the discussion about the indicators which are telling separate stories. Many hard data economic reports have been weak; the corporate debt level would seem to indicate the cycle should have ended already. Even with slow GDP growth last year and a debt cycle which appears to be near its end, the labor market remains strong. The stock market bulls can point to the strong labor market and re-emergence of profit growth as reasons to stay in the market. Valuations and productivity growth determine long-term performance, while these indicators along with low-interest rates affect short-term performance; this allows bulls to justify paying high multiples for stocks.
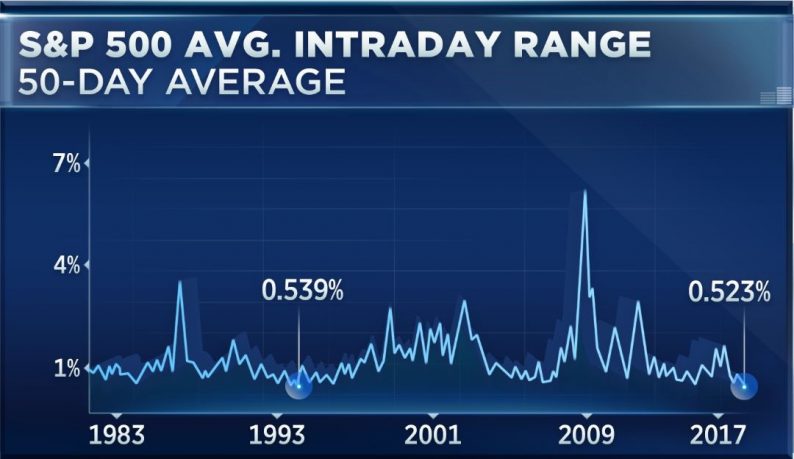
Before I review the latest economic news, I will discuss the stock market’s lack of volatility. As I have mentioned previously, the streak of not having a 1% daily decline in the S&P 500 is the longest since the start of this bull market. The streak has reached 100 trading days which is the longest since 1994. As you can see from the chart below, the S&P 500’s 50-day average intraday trading range is the lowest since at least 1983. The longest streak without a 1% decline was in 1963 and lasted 184 trading days.

This lack of volatility doesn’t mean anything on its own, but when it’s combined with the market’s high multiple, it’s disconcerting. In 1994, the Shiller PE was between 19.91 and 21.41. In 1963, the Shiller PE was between 19.26 and 21.04. The current Shiller PE is 29.11, which makes me feel the market won’t follow the same positive performance it has historically had following these periods of low volatility. The idea that fiscal policy uncertainty and low earnings growth makes this market “resilient” is laughable. It’s not a positive to have stocks exceed their intrinsic value.
The trend of weakening GDP growth, increasing corporate debt, a strengthening labor market, and an increasing stock market has been in place for a couple years. The trend remains in-tact with the latest data points. You would think these trends would clash at some point bringing the economy higher or lower, but it hasn’t happened yet. I guess it’s not surprising to see a divergence of indicators because the economy is neither in a recession nor in a recovery.


Leave A Comment