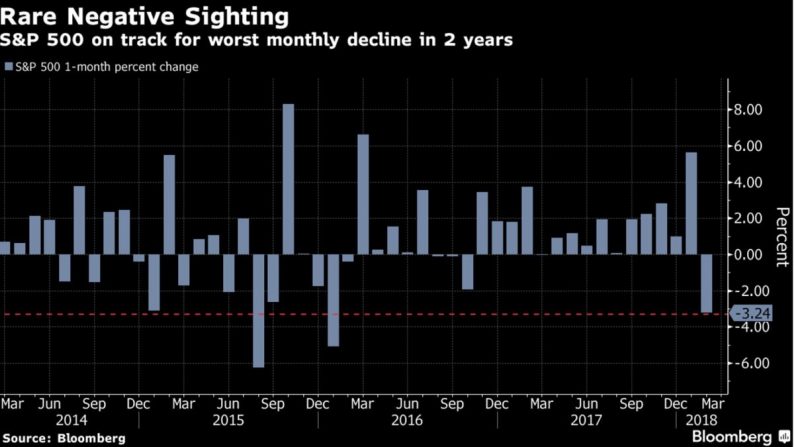
Worst Decline In 2 Years
With the S&P 500 falling 2.37% in the past two trading days, February closed with a whimper. Sometimes new money flows in on the first day of the month, so we’ll see how that plays out on Thursday. As you can see from the chart below, February was down 3.24% which was the worst performance since January 2016. It seems like the decline in January was catalyzed by economic weakness while this latest set back was caused by optimism getting out of hand. It’s an important comparison because, by understanding how much better the fundamentals are now, it makes it clearer that this is just a correction.

The biggest divergence between the two situations is that S&P 500 earnings had peaked in 2014, while they are at a record now. That 2016 decline was towards the end of the mini-downturn as the emerging market weakness and energy weakness took its tole on the overall market. Now we have record earnings, rising oil prices, and a rebounding global economy.
On the other hand, according to the Shiller PE, the stock market is much more expensive now. The Shiller PE was 24 on February 1st, 2016 while it’s at 32.83 now. The forward PE was about 15 in January 2016 and now it’s 17.1. You’re getting a more expensive market now with stronger fundamentals and much more investor optimism even after the correction. During the January 2016 decline, the bears actually outnumber the bulls.
Recession Not In Sight
Furthering the point of how different the economy is now versus January 2016, the chart below shows the odds of a recession based on credit markets. As you can see, the odds are at 13%. It was in the low 30s in January 2016. I’m not saying this is a great forecasting tool because clearly if stocks and bonds act in tandem with the economy, this indicator won’t forecast anything. It will tell you what you see on your screen.


Leave A Comment