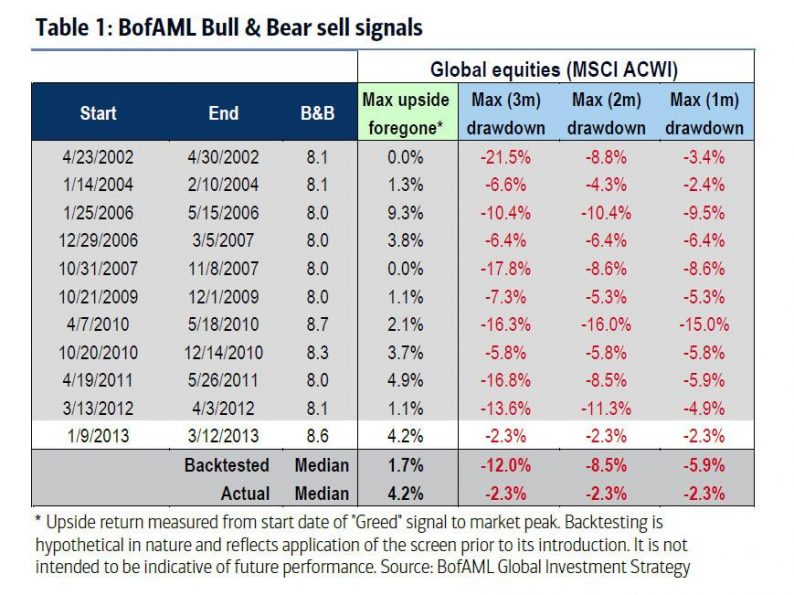
Exactly one month ago, just as the S&P hit all-time high, Bank of America caused a stir when it announced that one of its proprietary “guaranteed bear market” indicators created by the Bank of America quants was just triggered. As we when it announced , what was remarkable about this particular indicator is that it predicted not only the size of the upcoming drop (-12% on average) but also the timing (over the coming three months). Also notable: its uncanny accuracy: it was correct on 11 out of 11 previous occasions after it was triggered.

This is what BofA said then:
BofAML Bull & Bear indicator surges to 7.9, highest since last sell signal >8 triggered Mar’13;
BofAML Bull & Bear indicator has given 11 sell signals since 2002; hit ratio = 11/11; average equity peak-to-trough drop following 3 months = 12% (backtested, Table 1); note the last Bull & Bear indicator flashed was a buy signal of 0 on Feb 11th 2016
BofA’s conclusion: “a tactical S&P500 pullback to 2686 in Feb/Mar now very likely.” In retrospect, BofA was absolutely spot on, with a 10% correction hitting the very next week.
We bring this up, because that particular “crash” indicator was triggered in the context of BofA also reporting shortly prior, that 11 of 19 of its broader “bear market” signposts also being triggered.
So fast-forward to today, when the “bear market” is that much closer according to the strangely prophetic Bank of America, which reports that as of this month, another 2 indicators had been triggered, meaning that no less than 13 of 19 bear market signposts are now flashing red.
And this is what BofA said now:
In our 2018 Year Ahead, we compiled a list of bear market signposts that generally have occurred ahead of bear markets. No single indicator is perfect, and in this cycle, several will undoubtedly lag or not occur at all. But while single indicators may not be useful for market timing, they can be viewed as conservative preconditions for a bear market. Today, 13 of 19 (68%) have been triggered.


Leave A Comment