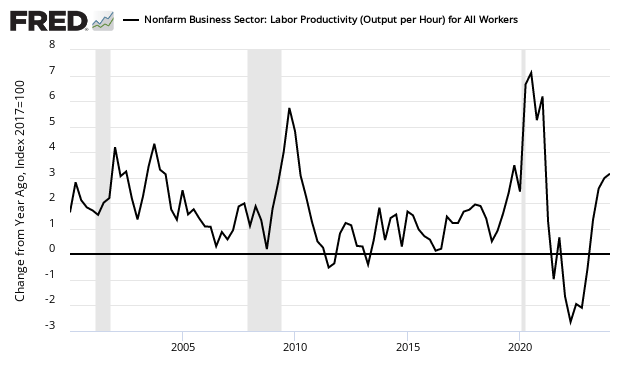
A simple summary of the headlines for this release is that the growth of productivity exceeded the growth of costs (headline quarter-over-quarter analysis). The year-over-year analysis says the opposite. I personally do not understand why anyone would look at the data in this series as the trends are changed from release to release – and significantly between the preliminary and final release.

The market was expecting:
The headlines annualize quarterly results (Econintersect uses year-over-year change in our analysis). If data is analyzed in year-over-year fashion, non-farm business productivity was up 0.4 % year-over-year, and unit labor costs were up 2.0 % year-over-year. Bottom line: the year-over-year data is saying that costs are still rising faster than productivity.
Although one could argue that productivity improvement must be cost effective, it is not true that all cost improvement are productivity improvements. [read more on this statement] Further, the productivity being measured is “capital productivity” – not “labor productivity”. [read more on this statement here]
Even though a decrease in productivity to the BLS could be considered an increase in productivity to an industrial engineer, this methodology does track recessions. [The current levels are well above recession territory.
Please note that the following graphs are for a sub-group of the report nonfarm > business.
Seasonally Adjusted Year-over-Year Change in Output of Business Sector

Seasonally Adjusted Year-over-Year Change of Output per Hour for the Business Sector

All this is happening while business sector unit labor costs increased – but growth is at a slower rate than last quarter.


Leave A Comment