If economics is the analyses of balance between supply and demand, the macro fundamental analysis is considering both social and economic indicators to assess the market direction and what stocks could outperform in a certain environment or under specific conditions.
This article covers 4 steel and iron stocks that are set to benefit from Trump’s tariffs. These stocks were identified based on the previously mentioned analysis in addition to price analysis.
When the news was released about President Donald Trump’s intention to impose global tariffs of 25 per cent on steel and 10 per cent on aluminium investors were disappointed, and the stock market took a bearish turn. Things only got worst when the European Union and China both voiced their dissatisfaction and promised to repay in kind if the tariff bill passed. The general reaction was questioning whether President Donald Trump understood what he was doing or not.
At InvestingHaven, we took a step back to analyse this important action from a neutral perspective, and examine the price action from the charts. If we consider the new tariffs objectively, InvestingHaven’s research team believes that President Trump is merely fulfilling his promise to Americans of bringing more businesses back to the America. Hence, the tariffs aim to encourage steel and iron companies in America to work and help one another internally thereby promoting economic growth.
Once these local companies have increasing business they will be able to employ more people, therefore creating jobs, which was another promise made by the president. As long as the economic growth is sustainable it is hard to argue against a bullish stock market outlook in the long run.
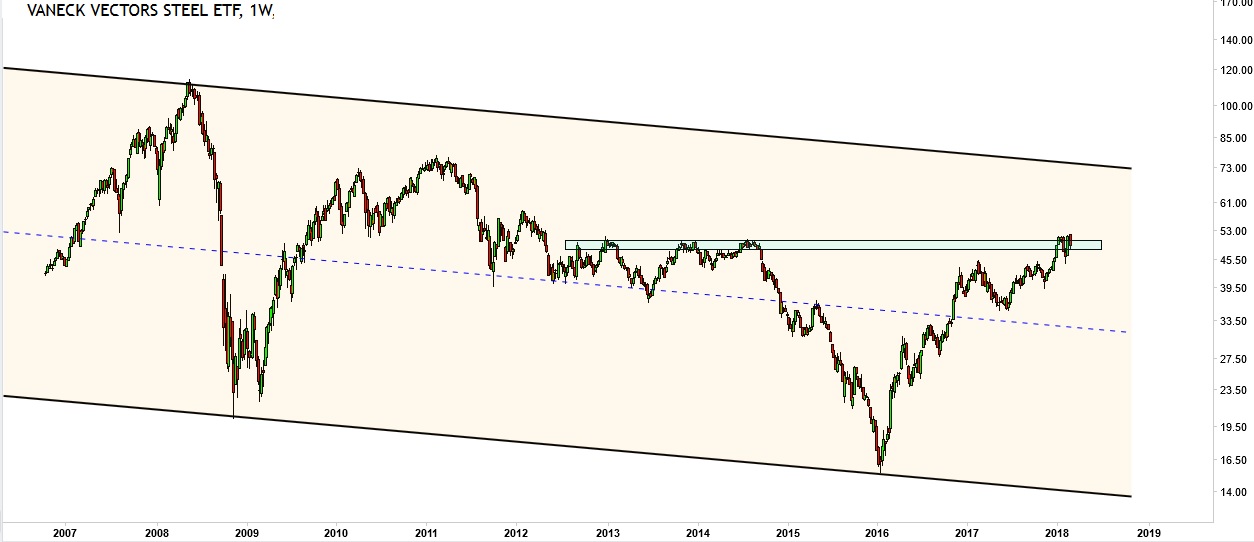
The most important sector ETF that covers the Iron and Steel industry is SLX. This ETF gives investors exposure to publicly traded companies primarily involved in steel production, including the operation of manufacturing mills, fabrication of productions and the extraction and reduction of iron ore. SLX is poised to benefit nicely from increased steel demand as the global economic recovery picks up speed and from continued investments in infrastructure. Although SLX was covered about 2 months ago, we will update the chart with the latest price action.

SLX price on the weekly chart is evolving in a diagonal channel. During the top in May 2008, which coincided with the global financial crisis, the price of SLX plunged in an almost vertical move from the top of the channel to the bottom. From then on the recovery was in a seesaw fashion and never really challenged the previous top. The price in fact drifted downwards and made another lower bottom in Jan 2016. It was a V-shape recovery that propelled the price to its major resistance of ~48 – 51. So far, this price is holding up well.


Leave A Comment