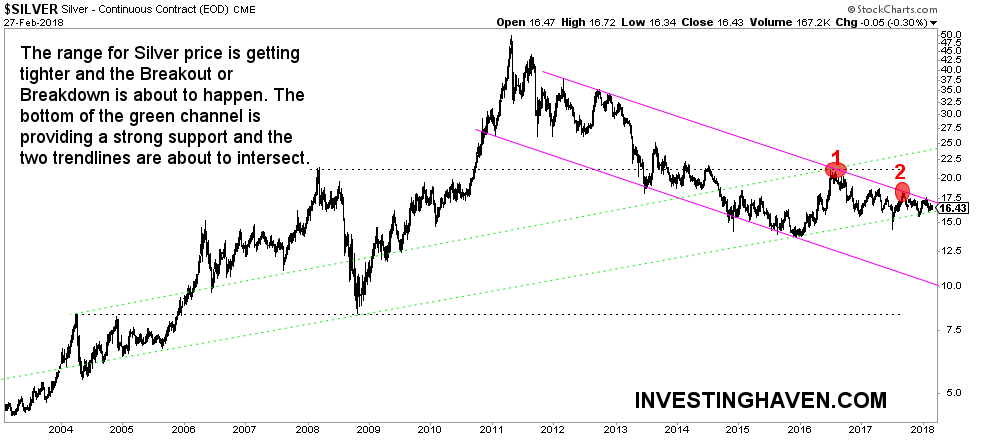
Silver price is trading in a tight range as we start 2018, and the range is getting tighter which makes it hard to forecast the next move. However, this is a good thing because we are almost at the tip of triangle and Silver will choose its next direction very soon.
Our article today will cover Silver price performance in 2018 so far and observations derived from the 15 then 5 years silver price charts. The objective is to see how the trend has been developing and silver price levels to watch as we are so close to 2 major outcomes for Silver:
The chart below shows how close we are to the resolution and therefore Silver price choosing the next direction. Given the chart setup: A 7 years old falling channel and a 2 years old sideways movement, we believe Silver is setting up for an important move.

As we can see, silver price trading below 16 USD will be very bearish unless it can recover extremely fast. The Bullish scenario will be confirmed at the cross above 21 USD.
In fact, even if silver price crosses above 17.5, it will still not be in Bullish territory since that could lead to another consolidation period. To make the picture clearer, we will zoom in and look at Silver price action for the last 5 years.
The chart below shows clearly that a break above 17.5 is good news for silver price because it means that the price is outside of the falling purple channel that lasted for 7 years now. It also shows that unless it crosses above 21 USD, the new channel could be the Black dotted channel, which means a sideways price action or a consolidation period.
The good news for Silver Bulls is there is massive support for the price in the 15.50 to 16.00 USD area and 2 trendlines acting as support (the dotted green and black trendlines).


Leave A Comment