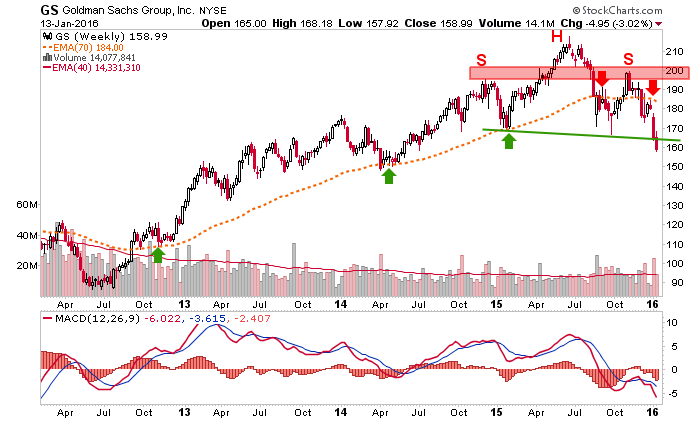
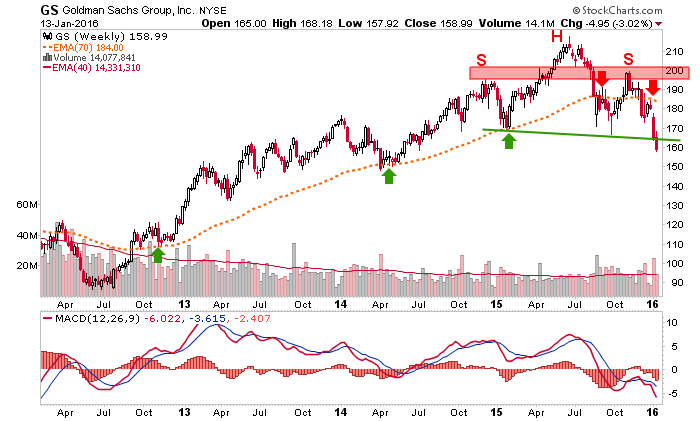
It’s both, the famous Vampire Squid… and a bearish chart. GS is a former NFTRH+ long idea in anticipation of the last big market bounce, but this week was included in NFTRH 377 as a bearish idea among several individual stock charts reviewed for subscribers. This one was a bearish looking potential H&S. But now, if it stays below the neckline on the week it will be an activated H&S. What’s more, it’s implied target is down below 120. That’s a good chunk of bearish.
Here is the weekly chart from the original ‘+’ (bullish) update that also had the resistance zone shaded at the bounce target (around 200). Boink, GS hit target and turned a perfectly good bull squid into a bear. Let’s see whether this week whipsaws or not. I personally took a shot at GS shot. I may add to it if it bounces to 165-170. I almost bought SPY at the close today, so obviously I still think the market can bounce; it’d just have to be from lower than I thought might be the case. More and more charts are starting to say ‘bounce or crash’ but considering my currently impaired ability to be on the market, I decided defensive is just fine for me in this market.

I continue to be in the midst of a challenging week that brought some unforeseen schedule and travel issues. So there may be better people out there than me at the moment where a finger on the market’s pulse is concerned. But I do see the Squid as a really bearish looking thing right now.


Leave A Comment