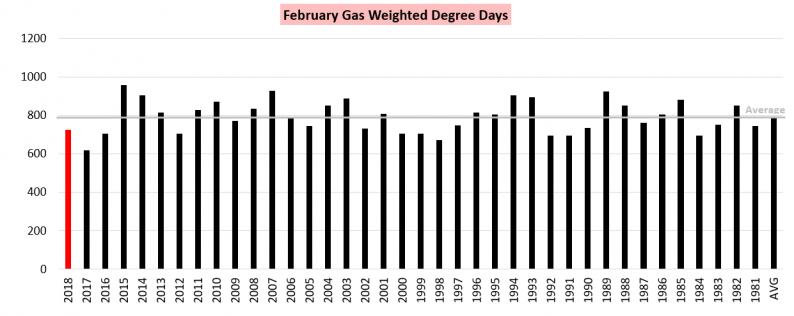
The official February heating demand prints are in, and they demonstrate a month that once again brought below average heating demand. This February was the coldest of the last three years, though following last winter’s record warmth that is certainly not saying much.
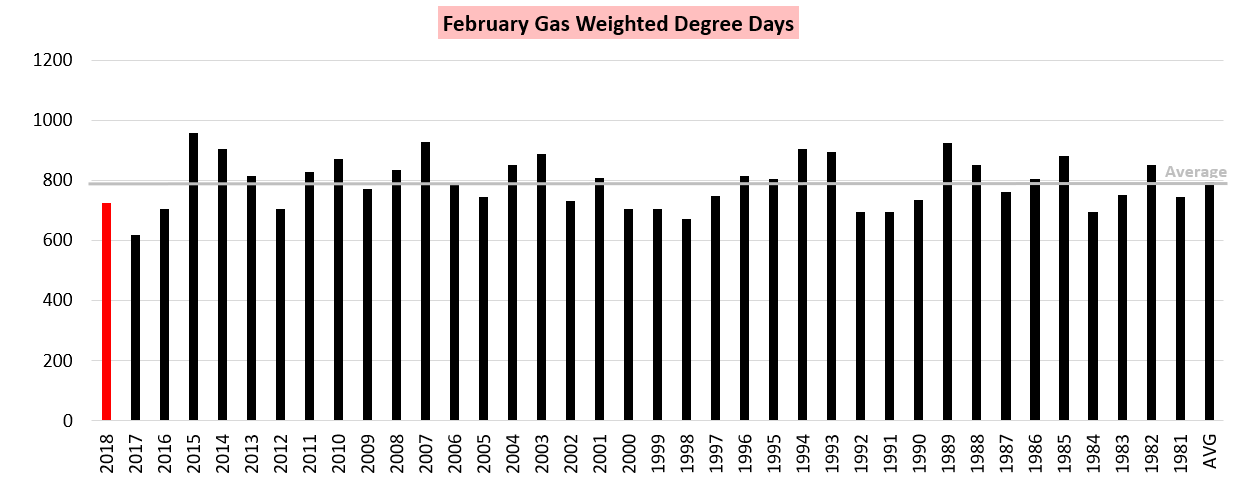
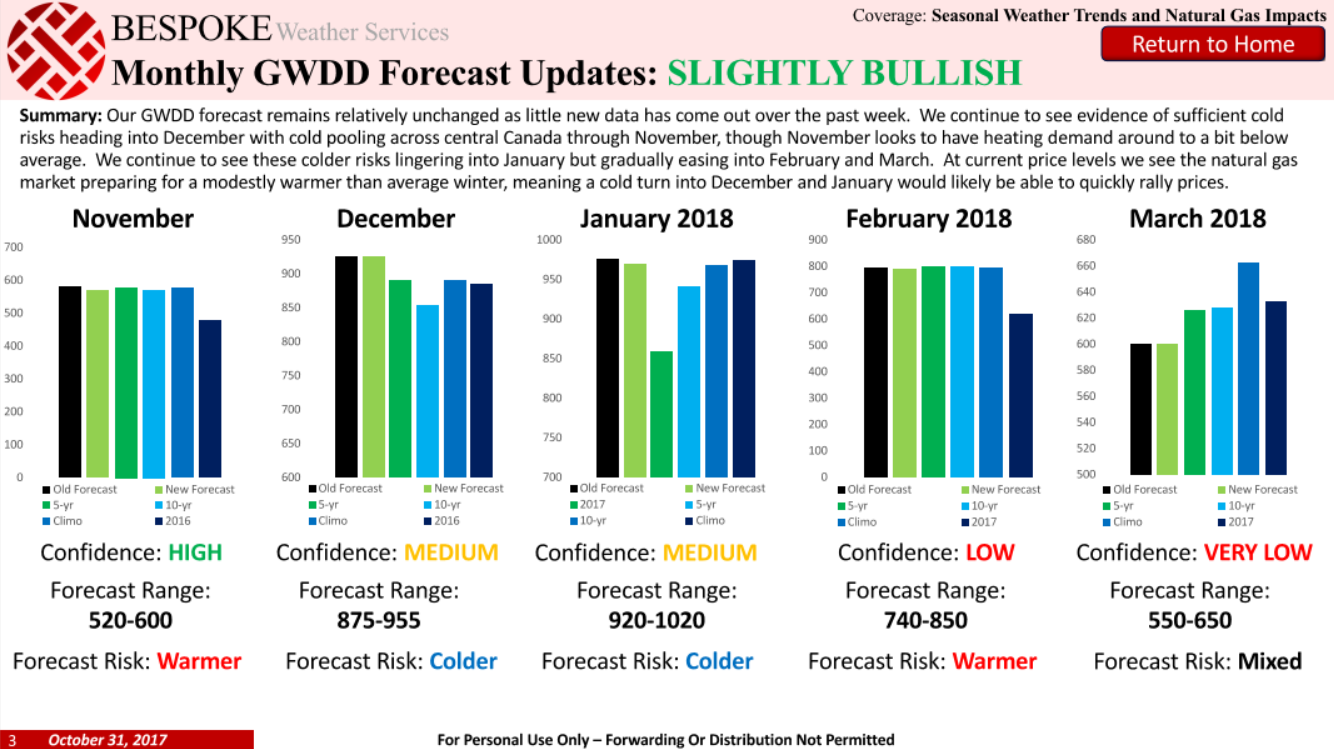
The final number came in at 726 Gas Weighted Degree Days (our blend of Utility Gas Weighted Heating Degree Days and Population Weighted Cooling Degree Days). This ended up being outside the range in our final Pre-Winter Seasonal Trader Report forecast from October 31st, though we had accurately listed the risk as warmer for the month.
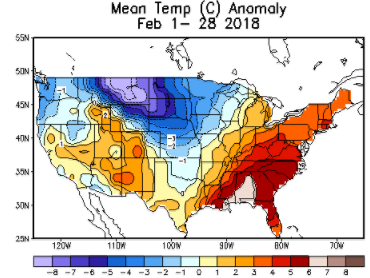
Per NOAA, we see that the month was significantly warmer across the East with cold focused back across the Great Plains.
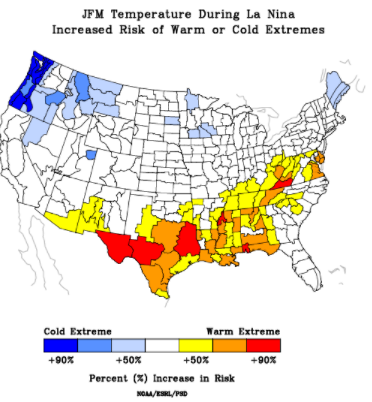
This matches rather well with the standard Jan/Feb/Mar La Nina risks, and though the pattern did not always develop classic La Nina characteristics through the month the end result had a clear La Nina signature.
February this year was record breaking in at least one way, however. Warmth across the Southeast was impressive enough that we set a record for most Population Weighted Cooling Degree Days (PWCDDs) for the month.
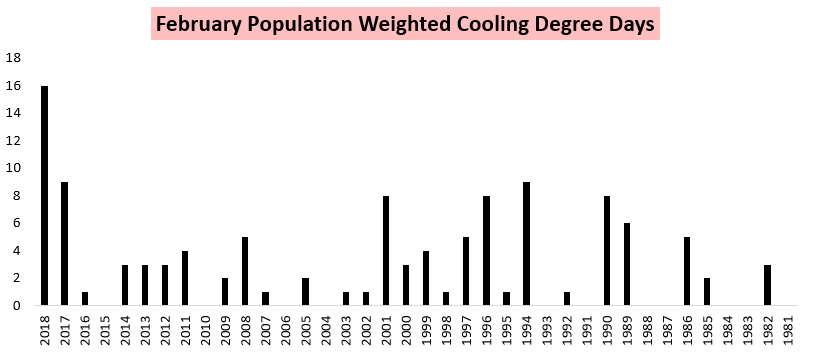
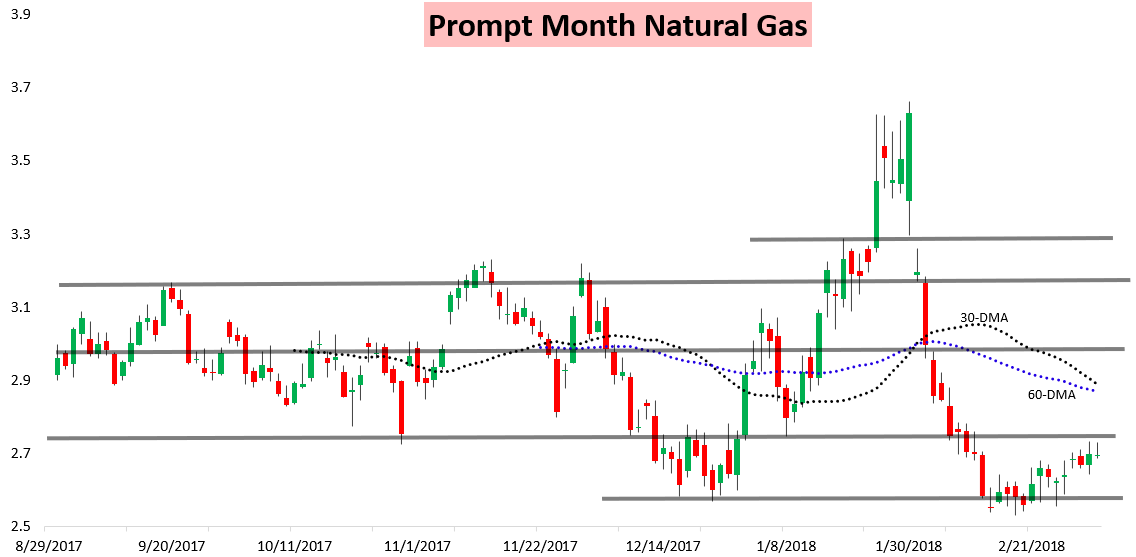
Of course, this was far from enough to make up for the heating demand losses seen across the East, and natural gas prices sold off very significantly through the month accordingly.
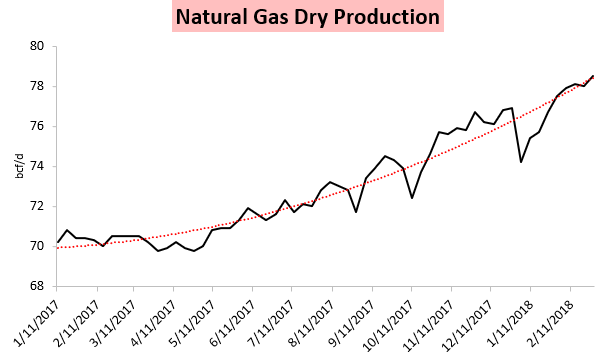
It didn’t help that natural gas dry production set another record in February.
Now into March attention begins turning to the next major weather-driven demand season: summer. Per the Climate Prediction Center we are most likely to see ENSO-neutral conditions this summer, with La Nina conditions being slightly more likely than El Nino conditions. However, the “Spring Barrier” (where models struggle to determine ENSO state changes and adjustments through the Spring) keeps confidence low.



Leave A Comment