AT40 = 19.4% of stocks are trading above their respective 40-day moving averages (DMAs) – first oversold day after 19 percentage point plunge
AT200 = 45.8% of stocks are trading above their respective 200DMAs
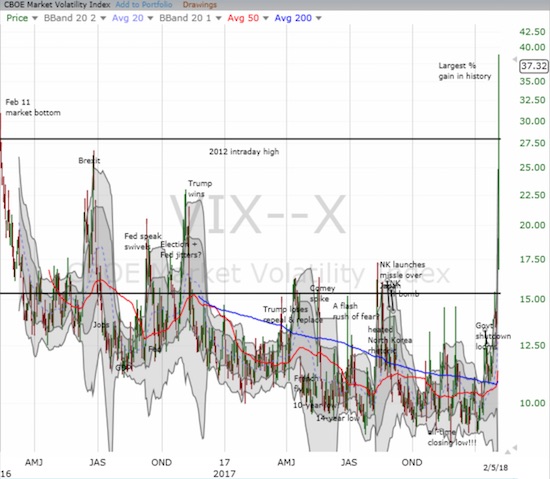
VIX = 17.3 (115.6% increase! The largest since at least 1990)
Short-term Trading Call: cautiously bullish – oh so many caveats below
Commentary
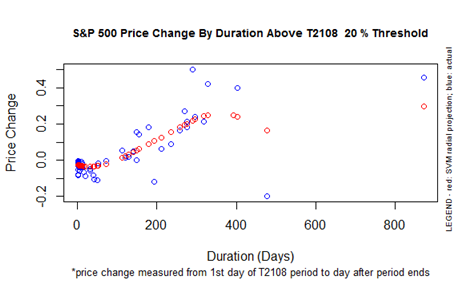
It was the JP Morgan bottom. On February 12, 2016, almost two years ago, AT40 (T2108), the percentage of stocks trading above their respective 40DMAs, bounced out of oversold conditions (below 20%). AT40 stayed out of oversold conditions for a near record 488 trading days. This period is called a “20% overperiod” because AT40 traded above 20%. Over that time, the S&P 500 gained 42%. In price performance, this past 20% overperiod ranks #3 since at least 1986 where my data end. In duration, this period ranks as the second longest. This was a truly historic moment for the stock market.

S&P 500 historical performance during the T2108 20% overperiod.
AT40 closed at 19.4% and is oversold. The aggressive trading strategy calls for buying right away because the typical oversold period only lasts 1 or 2 days. If the oversold period lasts longer, then the next wave of buying waits until the volatility index pulls back off a high. The conservative strategy calls for patiently waiting until the oversold period ends before buying. I see significant issues with both strategies given the unique nature of this sell-off.

AT40 (T2108) plunged from overbought to oversold in 9 days with the bulk of the loss in the last two days.
Practically in flash crash territory at this point. $SPY #T2108 #AT40
— Dr. Duru (@DrDuru) February 5, 2018
First, the market entered this oversold period with the volatility index already surging. In fact, the VIX hit an historic level and clocked a record 115.6% one-day gain (the data go back to 1990). The VIX has not traded this high, 37.3, since the 38.1 intraday high on August 25, 2015. The VIX last closed higher on August 24, 2015 when I wrote about how to profit from an EPIC oversold period in the wake of the flash crash that I later dubbed the “August Angst.” So, if the sell-off continues, I have no good bearing on how much higher the VIX could go. The VIX SHOULD be topping out right here. Even a pullback in the VIX amid such high level of panic may not provide a good indicator of the end of the stampede.

The volatility index, the VIX, zipped right through multiple important levels in the last two trading days.
Second, the S&P 500 (SPY) broke down below its 50-day moving average. The 4.1% loss took the index well below its lower-Bollinger Band (BB) and instantly plunged the index into negative territory for the year, now down 0.9% year-to-date. Say goodbye to all that new retirement and passive investment money that flooded the market in January (Wall Street I am sure is grateful). The index was up 7.5% for the year at the all-time high just over a week ago. Buying the market after the oversold period ends would likely face a quick test of stamina as the S&P 500 plows into resistance from the 50DMA – very poor risk/reward.


Leave A Comment