AT40 = 54.8% of stocks are trading above their respective 40-day moving averages (DMAs)
AT200 = 64.8% of stocks are trading above their respective 200DMAs
VIX = 15.1 (volatility index)
Short-term Trading Call: cautiously bullish (notable caveats explained below)
Commentary
The stock market has become incrementally more dangerous, yet buyers and bulls continue to succeed in bottling up the headwinds and in frustrating the sellers and bears.
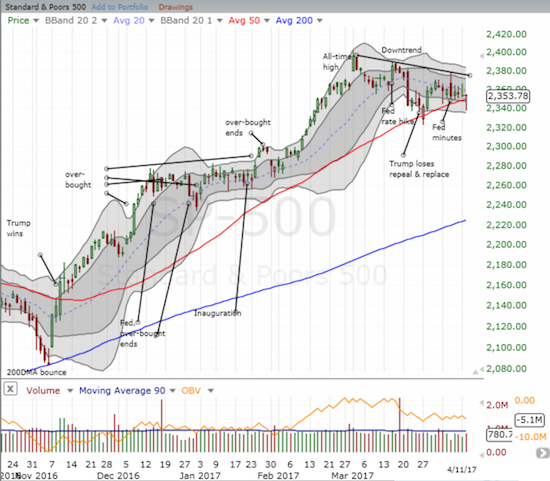
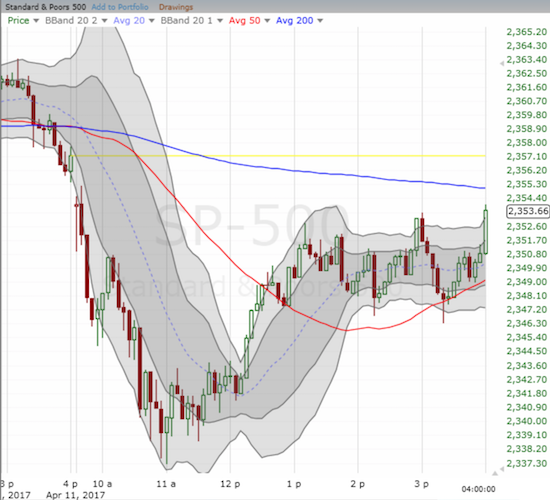
The 50-day moving average (DMA) was once again golden as the S&P 500 (SPY) fought off early weakness to bounce right back over this critical line of uptrending support. You just can’t make up these technical patterns!

The S&P 500 (SPY) dipped below its lowest close from the last 2 months. The 50DMA breakdown did not hold as buyers closed out the index above support.

Sellers held sway over the S&P 500 for the first 90 minutes of trading…and folded after that.
The S&P 500 has closed above its 50DMA every day since Donald J. Trump was elected President. The two breaks of this uptrending support over the past three weeks are the only real tests of this uptrend. The uptrend was so strong that the 20DMA played tour guide until mid-March. So, the struggle here is exceptionally important from a technical standpoint. As long as the sellers lack the will and the firepower to seize opportunities of weakness, my trading call sticks to (cautiously bullish).
Interestingly, AT40 (T2108), the percentage of stocks trading above their 40-day moving averages, has displayed the market’s underlying bid in recent days. Even as the S&P 500 just barely recovered from a 50DMA breakdown, AT40 comfortably closed at a one-month high. In fact, as the S&P 500 has struggled to go anywhere (up or down measured from the close) over the past four days since it sold off post-Fed minutes, AT40 has delivered notable gains three out of these four days. This is about as bullish a divergence as I have seen in a long time. (Is the market trying to anticipate the sudden eruption of world peace?)


Leave A Comment