
ADI Elliott Wave Analysis Trading Lounge Daily Chart,Analog Devices Inc., (ADI) Daily ChartADI Elliott Wave Technical AnalysisFUNCTION: TrendMODE: ImpulsiveSTRUCTURE: MotivePOSITION: Minor wave 3DIRECTION: Top in 3. DETAILS: Looking for continuation higher towards medium level at 250$. We have a nice alternation between a sideways wave {iv} and a sharp wave {ii}.  ADI Elliott Wave Analysis Trading Lounge 4Hr Chart,Analog Devices Inc., (ADI) 4Hr ChartADI Elliott Wave Technical AnalysisFUNCTION: TrendMODE: ImpulsiveSTRUCTURE: Motive POSITION: Wave {v}.DIRECTION: Upside in wave {v}.DETAILS: We seem to have completed the correction in wave {iv} with a clear three wave structure. Looking for continuation higher into equality of {v} vs. {i} at 254$.
  Welcome to our latest Elliott Wave analysis for Analog Devices Inc. (ADI) as of June 19, 2024. This analysis provides an in-depth look at ADI’s price movements using the Elliott Wave Theory, helping traders identify potential opportunities based on current trends and market structure. We will cover insights from both the daily and 4-hour charts to offer a comprehensive perspective on ADI’s market behavior. * ADI Elliott Wave Technical Analysis – Daily Chart*In our Elliott Wave analysis of Analog Devices Inc. (ADI), we observe an impulsive trend pattern characterized by a motive structure. ADI is currently positioned in Minor wave 3, indicating a continuation higher towards the medium level at $250. The wave structure shows a clear alternation between a sideways wave {iv} and a sharp wave {ii}, which is a typical feature in Elliott Wave theory, suggesting healthy trend progression. Traders should monitor for the top in Minor wave 3 and the potential transition into wave {v}, which could offer opportunities for profit-taking or strategic adjustments to long positions. * ADI Elliott Wave Technical Analysis – 4Hr Chart*On the 4-hour chart, ADI continues to follow an impulsive trend mode within a motive structure, specifically in wave {v}. The recent correction in wave {iv} appears to have completed with a clear three-wave structure, indicating a possible resumption of the uptrend. The target for wave {v} is set at the equality of {v} vs. {i} at $254. Traders should look for confirmation of this upward movement as the wave {v} progresses towards the target level, which may present opportunities for entering long positions or adding to existing ones.More By This Author:Elliott Wave Technical Analysis: Polkadot Crypto Price News For Wednesday, June 19
Commodities Market: Expert Elliott Wave Analysis & Profitable Trading Strategies
Elliott Wave Technical Analysis: Natural Gas – Tuesday, June 18

Related Posts
 Proofpoint Expands Through Tie-ups And Acquisitions
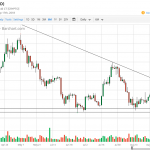 Bitcoin Daily Forecast – Tuesday, Sept. 18
 Exclusive: Dallas Fed Quietly Suspends Energy Mark-To-Market On Default Contagion Fears
- UK & High Yield Bonds: 2 ETFs Trading With Outsized Volume
- PE Firms Distributed $168B To LPs In Q1; VCs Dished Out $19.7B
- China Warns Of “Looming Trade War” With India In Retaliation To Anti-Dumping Duties
Leave A Comment