It’s been awhile since Apple underperformed the market. This week Apple is down 6% while the SP 500 is down 1%. The way I see it, Apple sets up nicely in this vicinity with a few key support confluence areas nearby.
Click on picture to enlarge
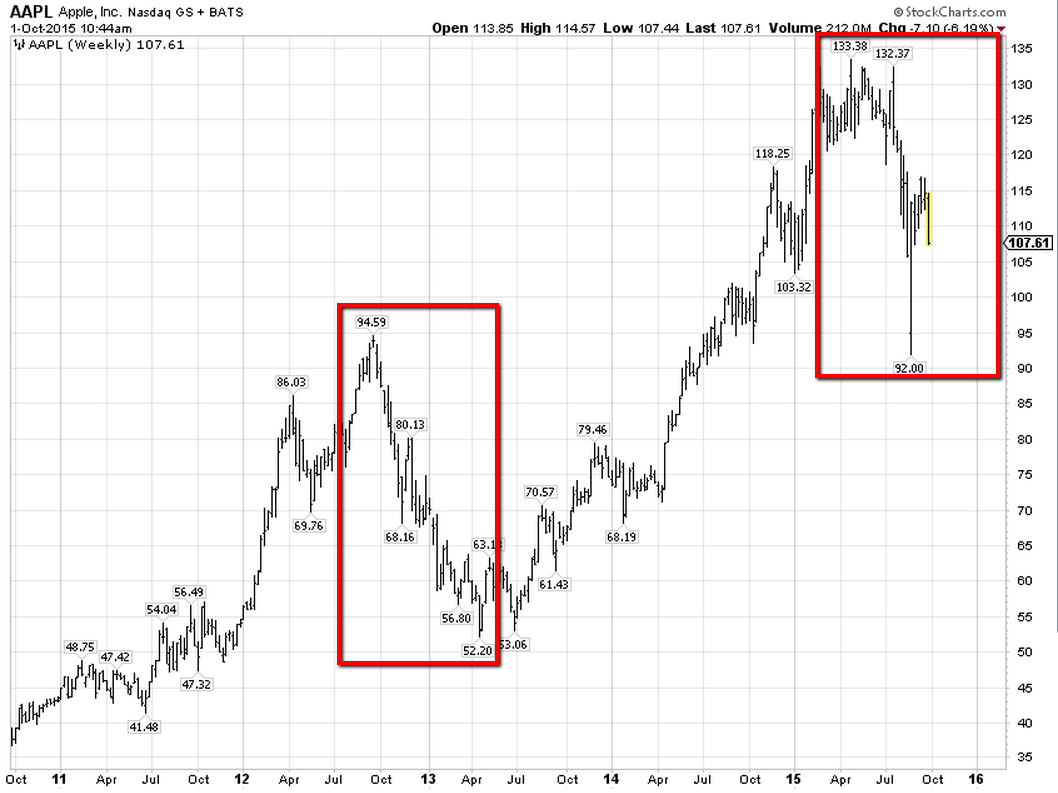
Apple’s stock price opened and hit $92 during the August 24th mini flash crash. This equaled the size of the 2012 decline ($40 points) and it coincided with the 2012 high as well ($94.59). This setup a great buying opportunity for those who were quick and brave enough to take it.
Click on picture to enlarge
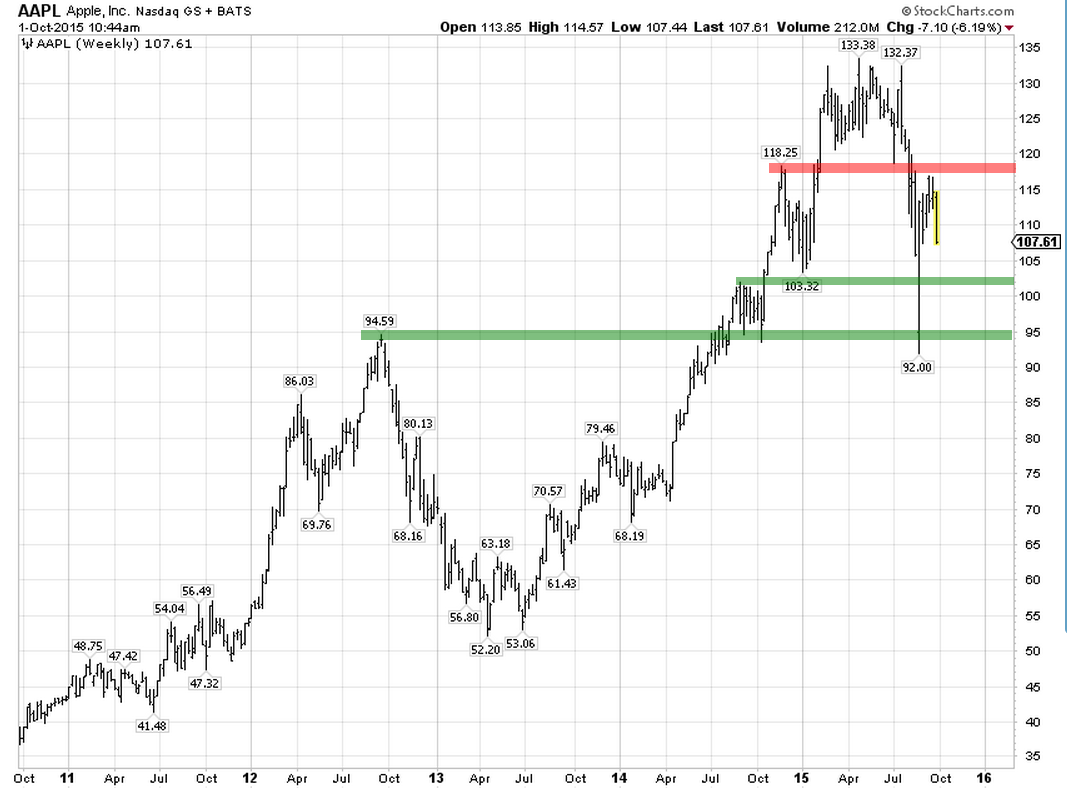
Apple’s support going forward comes in the $103-104 area, and then $95. Resistance stands at $118 and then all that’s left is the highs at $132-133.
Click on picture to enlarge
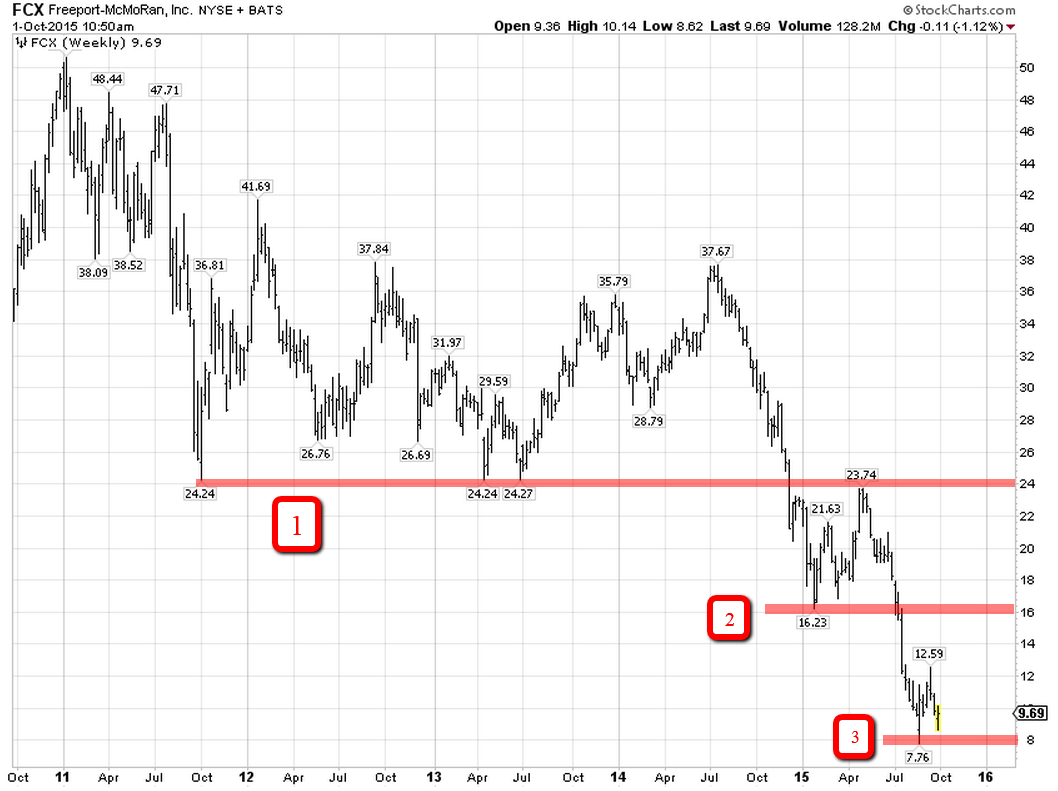
The next chart is Freeport McMoran. FCX largest shareholder is the famous activist investor Carl Icahn. The first pattern I see here is the symmetrical lower lows that come in about $8 apart (24, 16, 8). If $8 continues to hold, it sets up the likelihood of a move back up to $16, which is the prior swing low and would match the size of the last failed retracement rally.
The next resistance levels would be $20 and then lastly $24. If the stock price can somehow get above $24 there is some serious room to run here.





Leave A Comment